When Seeking Alpha reached out to me in late 2021 to see if I would be interested in writing an article about my outlook for 2022, I appreciated this opportunity to participate in their virtual round table. I hesitated for quite some time before slapping the picture of a bear on my article titled “Positions For 2022: A Changing Of The Guard” but I felt strongly enough about the challenges we were likely to face in 2022 that I decided to go ahead with it. I wrote the following in that article,
We are coming off two amazing stimulus fueled years where the S&P 500 and Nasdaq generated gains of 46% and 74%, respectively (at the time of writing) since the start of 2020. This is despite a recent pullback in growth stocks. Looking in from the outside and through the lens of a market participant in early 2020, this kind of performance during a global pandemic with multiple waves of infection is beyond comprehension. In other words, markets for the most part remain unpredictable. There’s one rule however that has managed to withstand the test of time and that is: “Don’t fight the Fed.” When the Fed decides to open or close the flood gates, it is better to go with the flow instead of fighting the strong current.
With both the government and market participants agreeing that inflation is not transitory, we’re likely to see Fed tightening and this could result in a “don’t fight the Fed” scenario, but in reverse.
The key driver of the stock market is likely to be Fed action and sector/style rotation as a result of anticipated higher interest rates.
The first interest rate hike last month was a modest 25 basis points but Jerome Powell indicated that a 50 basis point hike will be on the table in May. Market participants are now expecting at least two 50 basis point hikes and potentially a 75 basis point hike. A 75 basis point hike would be highly unusual and would signal that inflation is proving very challenging to control. In this environment, it is not surprising that the S&P 500 dropped nearly 3% last week and the Nasdaq pulled back 3.69%. While we might see some respite from selling in the coming days, the risk continues to remain on the downside for equities in general with a few pockets of opportunity.
Insider buying normally tends to rise during periods of market weakness but we have not yet seen that because we are in the midst of earnings season related quiet periods at most companies. I expect a significant uptick in insider buying next month. As I tweeted earlier this week, we are seeing a perplexing amount of insider buying in housing related companies and this week was no exception with the CEO of mortgage originator Rocket Companies RKT buying even more shares. The market, worried about a downturn in housing, has not really bid up these companies in recent months and hence many of them trade at very low valuations, as if often the case at cyclical peaks. It is possible that the insiders are either myopic and don’t see the big picture or are looking beyond this cycle and think they are well positioned after the cycle bottoms.
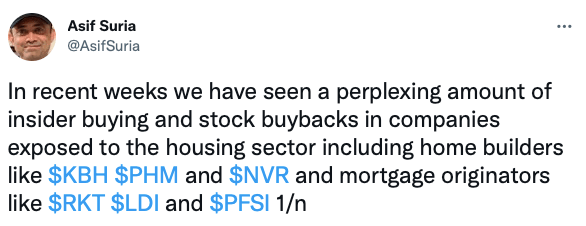
Insider Buying In Housing Related Stocks (source: Twitter)
An interesting insider purchase this week was by a Director of retail REIT CBL & Associates CBL, which emerged from bankruptcy in late 2021. Jonathan Heller, a Partner of Canyon Partners, joined CBL’s board last October. Canyon Partners is a multi-strategy hedge fund with nearly $21 billion in AUM that focuses on distressed securities, restructurings and real estate among other things. Considering CBL emerged from restructuring last year, it is not surprising to see Canyon involved. Mr. Heller made this purchase in multiple accounts including a joint account with his spouse and through a trust set up for the benefit of his children.
Insider buying declined last week with insiders purchasing $41.43 million of stock compared to $64.39 million in the week prior. Selling also decreased to $704.53 million compared to $1.58 billion in the week prior.
Sell/Buy Ratio: The insider Sell/Buy ratio is calculated by dividing the total insider sales in a given week by total insider purchases that week. The adjusted ratio for last week dropped to 17. In other words, insiders sold 17 times as much stock as they purchased. The Sell/Buy ratio this week was favorable compared to the prior week when the ratio stood at 24.52.
Notable Insider Buys:
1. CBL & Associates Properties, Inc. CBL: $29.09
Director Jonathan M. Heller acquired 100,000 shares of this retail REIT, paying $32.25 per share for a total amount of $3.23 million. 70,000 of these shares were purchased indirectly through a trust.
P/E: N/A Forward P/E: -74.59 Industry P/E: 36.33 P/S: 1.73 Price/Book: 12.63 EV/EBITDA: 10.8 Market Cap: $992.71M Avg. Daily Volume: 114,820 52 Week Range: $25.96 – $43.5
2. BlackRock, Inc. BLK: $662.94
Director William E. Ford acquired 3,000 shares of this asset management company, paying $687.96 per share for a total amount of $2.06 million. Mr. Ford increased his stake by 25.18% to 14,915 shares with this purchase.
P/E: 17.35 Forward P/E: 14.91 Industry P/E: 13.13 P/S: 5.19 Price/Book: 2.67 EV/EBITDA: 13.3 Market Cap: $100.59B Avg. Daily Volume: 869,446 52 Week Range: $660.15 – $973.16
3. Rocket Companies, Inc. RKT: $8.67
Chief Executive Officer Jay Farner acquired 129,000 shares of this mortgage and other loans originator, paying $9.28 per share for a total amount of $1.19 million. Mr. Farner increased his stake by 7.67% to 1,810,707 shares with this purchase.
P/E: 3.73 Forward P/E: 6.83 Industry P/E: 7.54 P/S: 1.31 Price/Book: 1.65 EV/EBITDA: 4.24 Market Cap: $17.23B Avg. Daily Volume: 5,505,265 52 Week Range: $8.66 – $23.33
4. Hasbro, Inc. HAS: $87.93
Chief Executive Officer Christian P. Cocks acquired 10,102 shares of Hasbro, paying $89.59 per share for a total amount of $905,046. Mr. Cocks increased his stake by 18.09% to 65,945 shares with this purchase.
P/E: 28.36 Forward P/E: 14.98 Industry P/E: 21.90 P/S: 1.9 Price/Book: 4.02 EV/EBITDA: 13.44 Market Cap: $12.22B Avg. Daily Volume: 1,390,963 52 Week Range: $81.16 – $105.73
5. Clene Inc. CLNN: $2.87
Director David J. Matlin acquired 132,891 shares of this biotech company, paying $3.01 per share for a total amount of $400,002. Mr. Matlin increased his stake by 7.77% to 1,844,288 shares with this purchase.
P/E: N/A Forward P/E: -5.42 Industry P/E: 81.33 P/S: 251.06 Price/Book: 14.21 EV/EBITDA: -3.33 Market Cap: $181.52M Avg. Daily Volume: 99,012 52 Week Range: $2.36 – $17.82
Notable Insider Sales:
1. Alphabet Inc. GOOG: $2392.28
Director Lawrence Page sold 83,332 shares of Alphabet for $2566.05, generating $213.83 million from the sale.
P/E: 21.32 Forward P/E: 17.44 Industry P/E: 20.16 P/S: 6.14 Price/Book: 6.29 EV/EBITDA: 16.13 Market Cap: $1.58T Avg. Daily Volume: 1,542,733 52 Week Range: $2230.05 – $3042
2. Bentley Systems, Incorporated BSY: $41.81
Director Raymond B. Bentley sold 464,605 shares of this infrastructure engineering software solutions provider for $44.05, generating $20.46 million from the sale.
P/E: 139.37 Forward P/E: 45.95 Industry P/E: 52.42 P/S: 12.47 Price/Book: 31.46 EV/EBITDA: 87.28 Market Cap: $12.03B Avg. Daily Volume: 977,131 52 Week Range: $34.45 – $71.92
3. Airbnb, Inc. ABNB: $156.09
Chief Financial Officer Dave Stephenson sold 35,000 shares of Airbnb for $177.81, generating $6.22 million from the sale.
P/E: N/A Forward P/E: 76.14 Industry P/E: 1,306.33 P/S: 16.75 Price/Book: 20.71 EV/EBITDA: 176.83 Market Cap: $100.35B Avg. Daily Volume: 5,987,901 52 Week Range: $129.71 – $212.584
4. Targa Resources Corp. TRGP: $76.17
Shares of this midstream energy assets owner were sold by 2 insiders:
- Director Joe Bob Perkins sold 66,350 shares for $78.37, generating $5.19 million from the sale. 38,406 of these shares were sold indirectly by the Perkins Blue House Investments Limited Partnership.
- Chief Commercial Officer Robert Muraro sold 10,000 shares for $80.10, generating $801,044 from the sale.
P/E: N/A Forward P/E: 17.23 Industry P/E: 11.84 P/S: 1.03 Price/Book: 8.64 EV/EBITDA: 12.63 Market Cap: $17.39B Avg. Daily Volume: 1,658,463 52 Week Range: $33.59 – $81.5
5. Interactive Brokers Group, Inc. IBKR: $61
Chairman Thomas Peterffy sold 80,000 shares of this investment brokerage for $65.18, generating $5.21 million from the sale.
P/E: 18.83 Forward P/E: 13.5 Industry P/E: 13.13 P/S: 9.24 Price/Book: 2.5 EV/EBITDA: N/A Market Cap: $25.42B Avg. Daily Volume: 893,673 52 Week Range: $56.95 – $82.83
Disclaimer: I hold a long position in Rocket Companies (RKT). Please do your own due diligence before buying or selling any securities mentioned in this article. We do not warrant the completeness or accuracy of the content or data provided in this article.
© 2024 Benzinga.com. Benzinga does not provide investment advice. All rights reserved.
Trade confidently with insights and alerts from analyst ratings, free reports and breaking news that affects the stocks you care about.

