An ugly Q3 in the books clouds the near-term reality—U.S. stocks were positioning for a third straight day of gains in early action. Asian and European equity markets started their final quarter of the year with gains, too.
Hopeful investors looked past data supporting earlier evidence of China's manufacturing sputter—there was no real downside shock in the latest figures and that was considered bullish news. Stocks may be finding some traction on back of oil pricing improvement; crude futures climbed back above $46 a barrel.
State-issued Chinese data showed manufacturing activity there continued to contract in September, just not as poorly as expected. China's official manufacturing purchasing managers index ticked up to 49.8 from 49.7 in August, marginally above consensus estimates of 49.7. Readings below 50 reflect contraction.
Euro-zone manufacturing data was also largely shrugged off even as one data firm said the risk of a stall was back. The euro-zone purchasing managers index declined to 52 in September from 52.3 in August as German expansion softened and France returned to growth. "Despite unprecedented central bank stimulus and substantial currency depreciation, the euro-zone manufacturing sector is failing to achieve significant growth momentum and even risks stalling again," Markit said in its release.
For the U.S.'s own September factory-sector reading due out today, Street economists look for a slight pullback in September to 50.6.
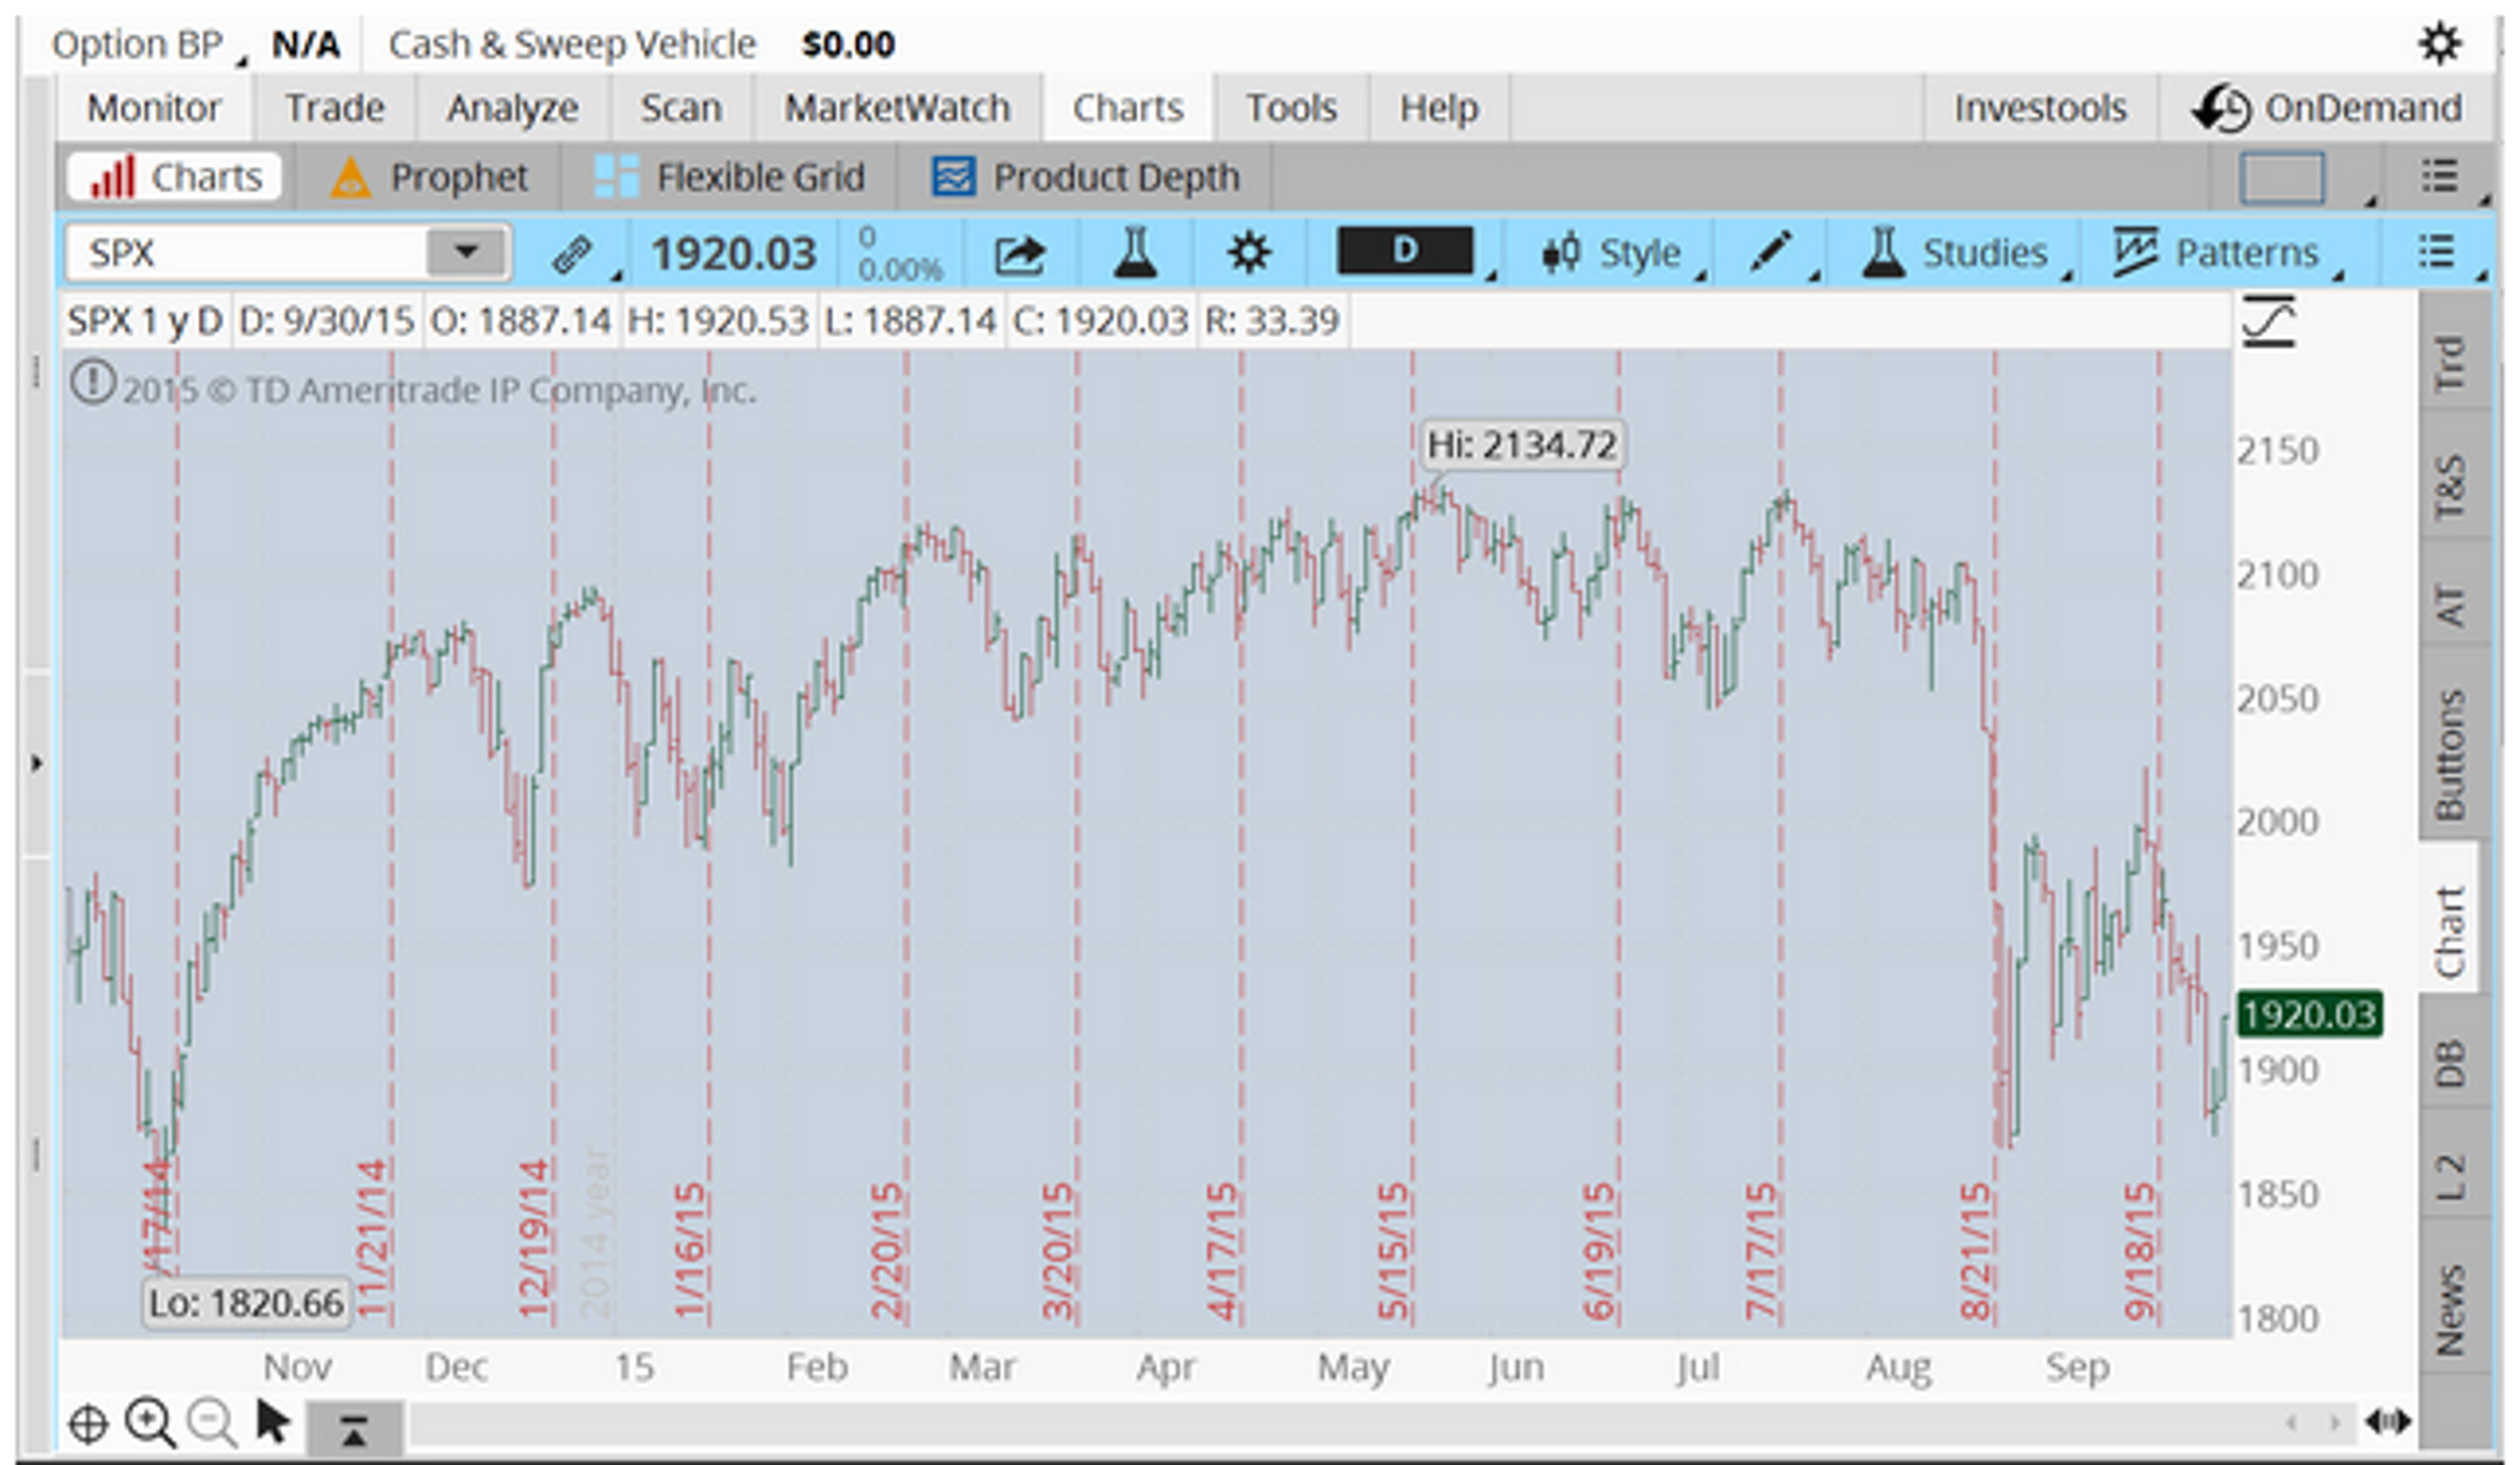
FIGURE 1: IS THE WEEK SALVAGEABLE? A one-year view of the S&P 500 ($SPX) charted on the new-look thinkorswim® platform shows Thursday's history-defying bounce—a rare September 30 advance. But the SPX remains just in negative territory for the week. Data source: Standard & Poor's. For illustrative purposes only. Past performance does not guarantee future results.By the Numbers
Most observers expect stock volatility to continue. Volatility certainly showed up in the stats. The S&P 500 ($
SPX) on Wednesday closed up 1.9%, bucking historical record-keeping that has shown September 30 to be one of the weakest days for the broader stock market.
In fact, FactSet data shows that yesterday's 1.9% gain was the fourth strongest performance this year and the third strongest for a September 30 going back to 1928. But that was just one day. The SPX closed a rough Q3 with a nearly 7% drop, with only the typically defensive utility sector logging a positive finish.
Of course, oil—and the broader commodities slump—has done its part to drive stocks lower. Both NYMEX-traded U.S. crude and Europe's Brent crude contract shed some 24% in Q3, and have logged declines for four of the past five quarters.
Blue-Chip Dow, Too
The blue-chip Dow Jones Industrial Average ($
DJI) joined Wednesday's party but that may only mask what truly has been a notable losing streak. The DJIA surged 236 points on Wednesday, but has lost 1,335 points, or 7.6%, since the end of June.
The Dow had lost 156.61 points, or 0.9%, over Q2 and 46.95 points, or 0.3%, over Q1—narrowly lower results, yes, but negative nonetheless. The last time the Dow had a three-quarter losing streak was during the 2009 recession.
Good, For Now
The House of Representatives passed a bill Wednesday, by a vote of 277 to 151, to keep the federal government operating through Dec. 11. The bill was passed earlier by the Senate and now signed by President Barack Obama.
Without the stopgap bill the government would have shut down Thursday, the first day of the new fiscal year. The White House and Republicans are now negotiating a longer budget deal.
Good trading,
JJ
@TDAJJKinahanThis piece was originally posted here by JJ Kinahan on October 1, 2015.Market volatility, volume, and system availability may delay account access and trade executions. Past performance of a security or strategy does not guarantee future results or success.
Options are not suitable for all investors as the special risks inherent to options trading may expose investors to potentially rapid and substantial losses.
Options trading subject to TD Ameritrade review and approval. Please read Characteristics and Risks of Standardized Options before investing in options. Supporting documentation for any claims, comparisons, statistics, or other technical data will be supplied upon request. The information is not intended to be investment advice or construed as a recommendation or endorsement of any particular investment or investment strategy, and is for illustrative purposes only.
Be sure to understand all risks involved with each strategy, including commission costs, before attempting to place any trade. Clients must consider all relevant risk factors, including their own personal financial situations, before trading. TD Ameritrade, Inc., member FINRA/SIPC. TD Ameritrade is a trademark jointly owned by TD Ameritrade IP Company, Inc. and The Toronto-Dominion Bank. © 2015 TD Ameritrade IP Company, Inc. All rights reserved. Used with permission.