Spot gold was trading flat Wednesday, continuing to consolidate in a sideways pattern after reaching record highs in April, partly propelled by China escalating its purchases of the commodity.
For cyclical investors, spot gold’s consolidation following the metal’s steep bull run could signal that traders will begin switching their focus toward gold miners, the latter which has underperformed the movement of the physical commodity.
Direxion Daily Gold Miners Index Bull 2X Shares NUGT invests in a variety of publicly traded firms with global operations in both developed and emerging markets. These companies are predominantly involved in gold mining, with some also engaged in silver mining, but to a lesser degree.
Trending: DOGE Is The 'BTC Of Memes' And These Two Meme Coins Are The ETH And A 'Must Have,' Trader Touts
NUGT is a double-leveraged fund designed to outperform the NYSE Arca Gold Miners Index by 200%. Some of NUGT’s most popular holdings include Newmont Corp NEM, Barrick Gold Corp GOLD and Franco-Nevada Corp FNV, which make up 30.05% of its holdings.
It should be noted that leveraged ETFs are meant to be used as a trading vehicle by experienced traders, as opposed to a long-term investment. Leveraged ETFs should never be used by an investor with a buy-and-hold strategy or those who have low-risk appetites.
For traders who are bearish on the gold mining sector, Direxion offers Direxion Daily Gold Miners Index Bear 2X Shares DUST.
Want direct analysis? Find me in the BZ Pro lounge! Click here for a free trial.
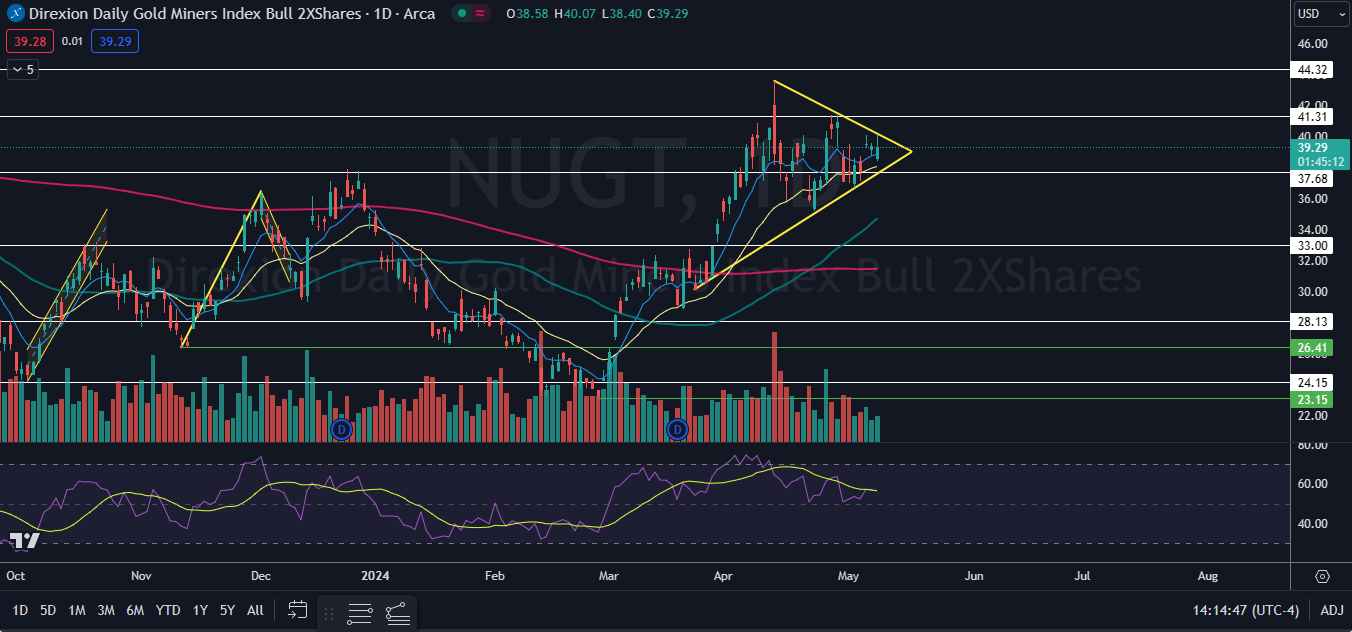
The NUGT Chart: Like spot gold, NUGT has been trading in a mostly sideways pattern since April 12 but with a higher level of daily volatility. The horizontal pattern, paired with the volatility, has caused NUGT to settle into a symmetrical triangle pattern on the daily chart.
- On Wednesday, NUGT attempted to break through the upper descending trend line of the triangle but failed and wicked down from that area. NUGT’s failure to break bullishly from the pattern is likely due to the ETF trading on lower-than-average volume.
- Bullish traders want to see NUGT continue to trade near the upper trend line of the triangle and then for big bullish volume to come in and cause a bullish break from the pattern. If that happens, it could signal a longer-term run back toward the April high is on the horizon.
- Bearish traders want to see bearish volume drop NUGT down toward the bottom trend line of the pattern, which would cause the ETF to lose support at the eight-day exponential moving average. If that occurs, increasing bearish volume could come in and cause NUGT to break down from the triangle.
- NUGT has resistance above at $41.31 and at $44.32 and support below at $37.68 and at $33.

© 2024 Benzinga.com. Benzinga does not provide investment advice. All rights reserved.
Comments
Trade confidently with insights and alerts from analyst ratings, free reports and breaking news that affects the stocks you care about.