
Benzinga API as an Alternative to Yahoo Finance
In the world of trading, data is the most important thing. It is not a stereotype to say, “Data is the King.” It is just a simple and plain truth. Some years ago, Yahoo Finance was the ultimate go-to solution for anyone – from businesses to retail investors- to find reliable data. However, after the official Yahoo Finance library was discontinued, accessing reliable financial data became challenging.
Benzinga API comes into the picture to fill this gap and be a potential alternative to Yahoo Finance. Their robust API provides reliable and a large variety of data:
- Historic pricing of various time frames for thousands of instruments in the world
- Fundamental data of most of the publicly traded companies with their history
- Detailed analysts’ insights the moment they are published.
- Newsfeeds, Signals, SEC filings, and much more
- Last but not least (since you are paying a subscription), professional support that you cannot expect from data sources like Yahoo Finance
Benzinga’s comprehensive data offerings, reliability, and professional support allow anyone to explore market opportunities, backtest trading strategies or automate their data pipelines.
How to get the data
Benzinga provides a well-structured API where you can get the data that you require with ease using various methods like:
- Benzinga API Documentation
- Excel
- Python (or any other programming language you prefer)
So, let’s explore how to get Apple’s candle data for the last year using the GET bars API.
Trying Benzinga API through its Documentation
Firstly, head over to the documentation page. As soon as you navigate with your browser to the API of your choice (in our example, Get bars), you will see the green button “Try it” along with the rest of the documentation for the specific API, such as the query parameters and a template of the response you should expect.

After selecting the “Try it” button, a screen will open where you can input your API key and the rest of the information, like the symbol (AAPL) and starting date (1Y), to request a year’s data.

An intuitive testing environment is the perfect starting point to understand what data is available and how it’s structured. By experimenting with different parameters, you can fine-tune your data requests before implementing them in your trading system. Even non-technical users can use this interface to check data options without writing code, helping bridge the gap between understanding the available data and the actual implementation.
Let’s see how this data can be used in a more structured way. And if “Data is the King”, then ”Excel is the Queen”.
Extracting Data using Excel
To get the data of the candles in Excel, follow the below steps:
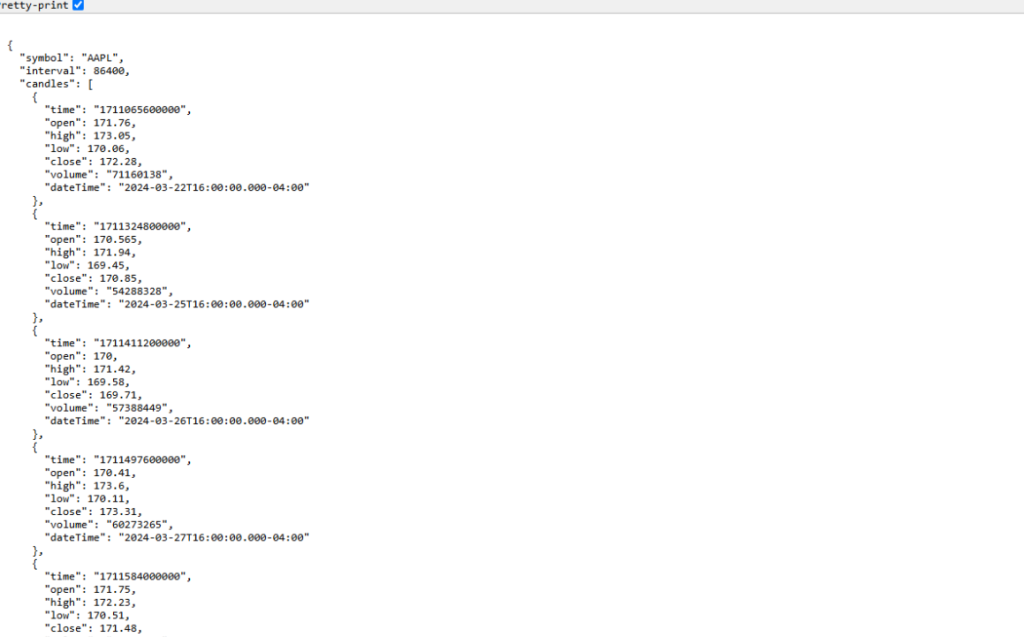
First, you should identify the URL that will provide the data. In the above case, we would like to load last year’s candles for AAPL, the URL will look like this:
https://api.benzinga.com/api/v2/bars?token=&symbols=AAPL&from=1Y
Just update the URL with your token, and you will be ready. You can check it even on your browser:
What makes this approach particularly powerful is the ability to customize your data requests by modifying the URL parameters. Need hourly data instead of daily data? Want to compare multiple symbols? Simply adjust the parameters accordingly. This flexibility transforms Excel from a static spreadsheet into a dynamic trading tool that grows with your analytical requirements.
Now, let’s see how you will get the data in your Excel spreadsheet. Initially, you should go to Data > New Query > From Other Sources > From Web

What you need to do now is to add the URL when you are asked, and then:
- Select the Record and List so you drill down to the list of all the candles where you will be seeing it as “Record” and convert to table
- You can then expand the fields and select “Close and Load.”
You should be able to see the candles in your excel:

Once your data connection is established, you can use Excel’s powerful features to build comprehensive trading dashboards, do backtesting, or just get some simple answers to your questions on the fly. Create custom visualizations with candlestick charts, add technical indicators using Excel formulas, or build correlation tables across multiple assets. The best part is that when you do that the first time, you don’t have to do that again – you just press refresh on the connection, and you will be able to get the latest data.
The Python way
With Python, you can build sophisticated data pipelines that automatically collect, clean, and analyze Benzinga data. Here’s a simple example to get started:
import requests
import pandas as pd

token = '<YOUR API KEY>'

url = "https://api.benzinga.com/api/v2/bars"
querystring = {"token":token, "symbols":"AAPL", "interval":"1m", "from":"1Y"}
headers = {"accept": "application/json"}

response = requests.request("GET", url, headers=headers, params=querystring).json()

df = pd.DataFrame(response[0]['candles'])

The true power of Python lies in automation and advanced analytics. You can schedule scripts to run daily, apply machine learning models to identify patterns or build complete backtesting frameworks to evaluate trading strategies against historical data. For algorithmic traders, Python provides the flexibility to integrate multiple data sources and develop proprietary indicators that might give you the edge you seek.
Beyond Price Data: Earnings and Analyst Insights
While price data is the absolute must for any trading strategies, Benzinga offers a wealth of additional information that can provide crucial context to your analysis. Two valuable endpoints are:
- Earnings Calendar: Access upcoming and historical earnings announcements, helping you prepare for potential market-moving events.
- Analyst Ratings: Get professional opinions and price targets from various financial institutions, offering insights into market sentiment.
These endpoints can be accessed using similar methods to the candle data we’ve explored, whether through the API interface, Excel, or Python. By incorporating this fundamental data alongside technical analysis, traders can develop a more holistic view of their target securities.
Earnings Data
The following is the code to extract earnings data using Benzinga API (detailed documentation can be found here):
import requests
import pandas as pd

token = <YOUR API KEY>

url = "https://api.benzinga.com/api/v2.1/calendar/earnings"
querystring = {"token": token, "parameters[tickers]":"AAPL","pagesize":"1000"}
headers = {"accept": "application/json"}

response = requests.request("GET", url, headers=headers, params=querystring).json()

df = pd.DataFrame(response['earnings'])

Benzinga’s earnings calendar provides traders with essential information on upcoming and historical earnings announcements. This data helps traders prepare for significant events by avoiding positions before high-volatility earnings releases. By accessing the earnings calendar, you can enhance your risk management or backtest the market’s reaction to the company’s earnings announcements historically.
Analysts Insights
Analyst ratings data is also really valuable, providing in-depth insights into a company. The code to extract analyst ratings data can be found below, and here’s the documentation for detailed info:
import requests
import pandas as pd

token = <YOUR API KEY>
url = "https://api.benzinga.com/api/v1/analyst/insights"
querystring = {"token": token,"page":"1","pageSize":"10","symbols":"AAPL"}
headers = {"accept": "application/json"}

response = requests.request("GET", url, headers=headers, params=querystring).json()

df = pd.DataFrame(response['analyst-insights'])

Analyst ratings provide valuable professional opinions and price targets. These insights help traders gauge market sentiment and assess whether a stock’s price aligns with expert valuations. By incorporating analyst data into trading strategies, traders can develop a more comprehensive view of their target securities. Like earnings data, analyst insights can be accessed through Benzinga’s API and integrated into Excel or Python for seamless analysis and decision-making.
Conclusion
In conclusion, businesses need reliable and affordable data to catch up with today’s fast-paced trading world. Benzinga API positions itself as a significant data provider with reliable and affordable data. By adding their API to your data operations, you can research, backtest trading strategies, follow up the news and analysts’ reports as they come out, and ensure that you have high-quality, real-time financial data to make important decisions on the go.

