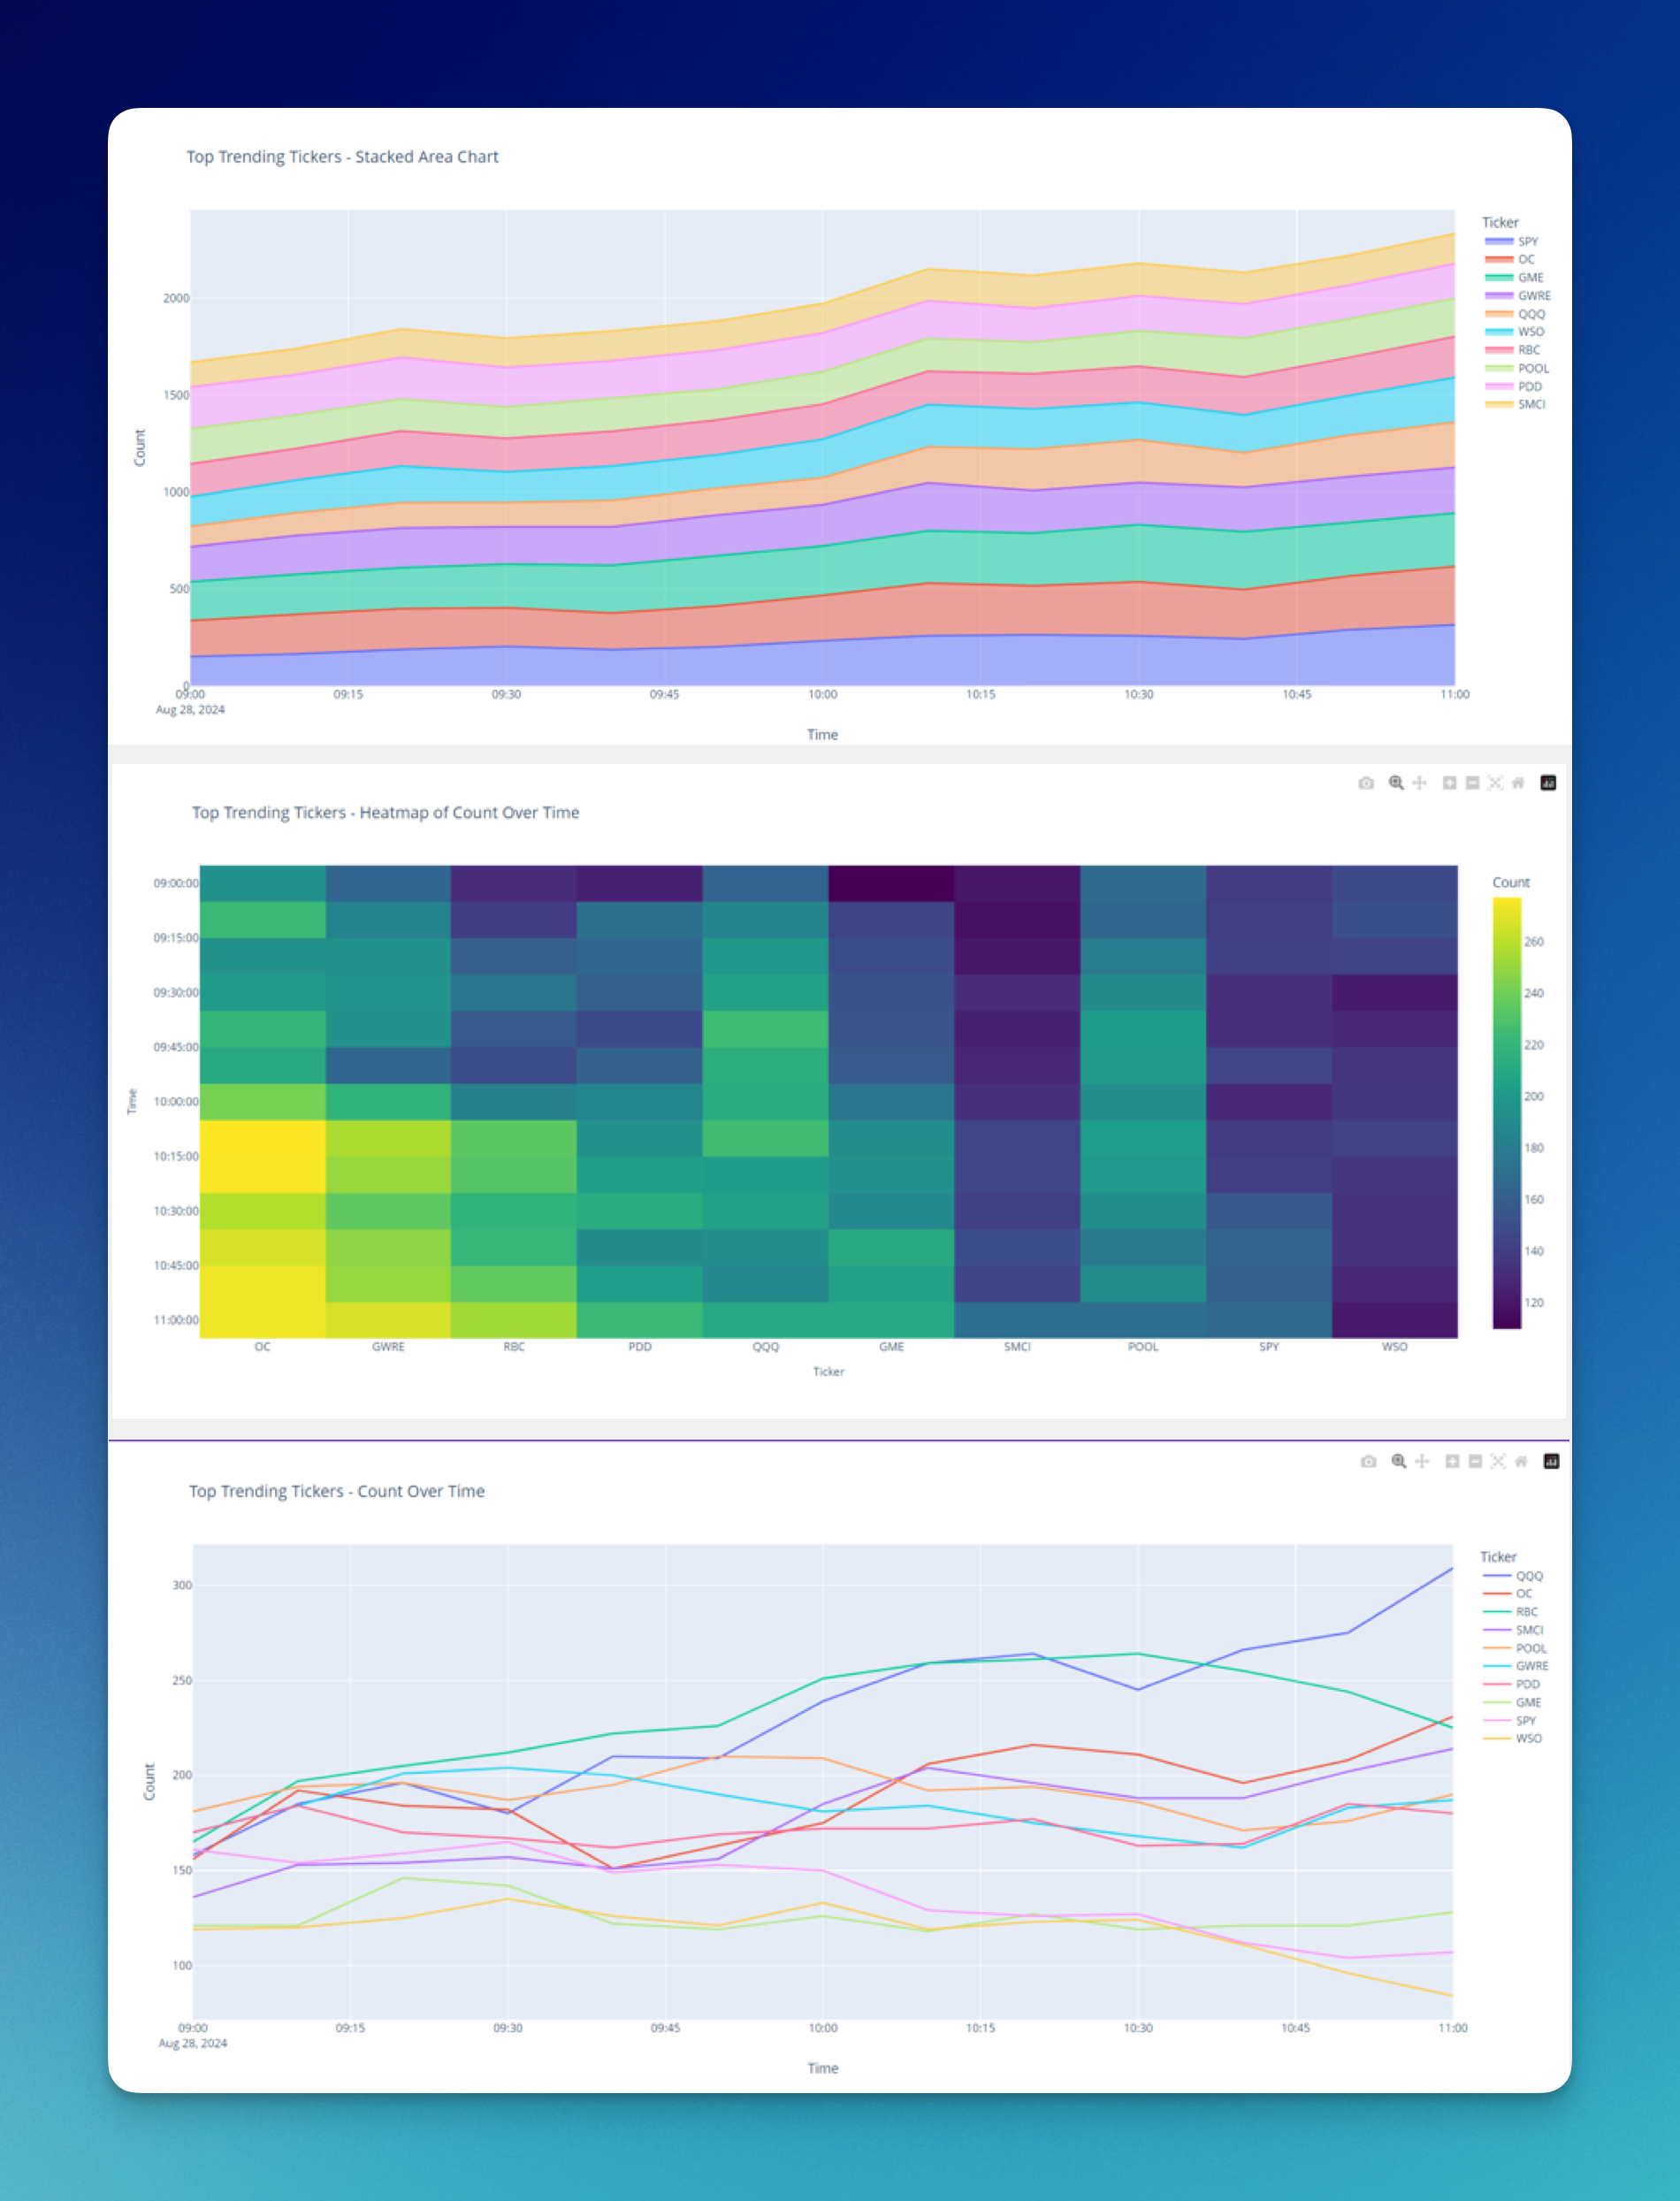
In the fast-paced world of financial markets, staying ahead requires more than just traditional data sources. Trending Tickers delivers a unique edge by providing real-time insights into retail investor sentiment, allowing hedge funds and quantitative strategies to capitalize on emerging trends. Powered by Benzinga’s proprietary analytics, this tool offers unparalleled visibility into retail-driven market activity.

Start Building Product
Retail investors are an increasingly influential force in market dynamics, and understanding their behavior has become critical for generating alpha. Trending Tickers aggregates data from millions of page views to highlight which stocks are commanding attention, providing hedge funds and quants with a powerful proxy for gauging retail interest. By combining this data with your proprietary models, you can refine strategies, identify mispricings, and predict price momentum driven by retail activity.
Analyst ratings are extremely helpful for novice investors – they stand as a point of reference by showing where professionals think a stock is headed. This information is also valuable for experienced investors, ratings can help validate or question an investment thesis.
| Attribute | Description |
| ID | Unique ID of the output |
| date | Datestamp |
| ticker | Ticker Symbol |
| count | Count of views on the content |
| time_bucket | The time bucket in which the views are grouped by |
| isin | ISIN identifier |
| ticker | Ticker symbol |
| exchange | Exchange the security is traded on |
| name | Company name of the security |
| percent_change | The percent increase / decrease between consecutive time buckets |
| raw_change | This is the increase / decrease in raw values between consecutive time buckets. |
| count_mavg | Trailing weekly moving average for this ticker, exchange, bucket over the past 4 weeks using the count field. For example, AAPL’s count_mavg for 14:00 UTC on Wednesday would be the average of its current value and the last 3 Wednesdays at 14:00 UTC (4 weeks in total). |
| scaled_count | Total requests or page views for this ticker within the time bucket specified, scaled between [0,100]. This value represents what percentage of the maximum value the count amount is over the past 30 days compared to all count amounts across all tickers. |
| scaled_count_mavg | Trailing weekly moving average for this ticker, exchange, bucket over the past 4 weeks scaled between [0,100]. See count_mavg definition of moving average. |
| market_count_average | The average market count during this bucket for all tickers in our universe. |
For quantitative funds, Trending Tickers integrates seamlessly into algorithmic workflows. Scaled metrics and comparative data offer a structured way to incorporate retail sentiment into factor models or signal generation. Anomaly detection provides early indicators of retail-driven volatility, ensuring that you’re ahead of the curve. Whether you’re monitoring retail influence on mega-cap stocks or uncovering hidden gems in mid- and small-cap spaces, this tool delivers actionable insights.
Use Cases
- Investors: Spot market opportunities by tracking retail interest in real-time.
- Analysts: Enhance reports with dynamic data on trending tickers.
- Financial Media: Discover emerging market stories and drive audience engagement.
- Quants: Integrate anomaly detection into algorithmic strategies.
Leverage the power of Trending Tickers to stay informed, adaptable, and data-driven in an ever-changing market. Visit our documentation to explore how our insights can integrate into your strategy or contact us for a tailored demo.

