
- Ethereum price is trading in the red marginally, down 0.60% the session on Thursday.
- ETH/USD is moving within consolidation mode following the strong range brekaout on Wednesday.
- The next major area of attraction for the bulls will likely be the pychological $200 mark.
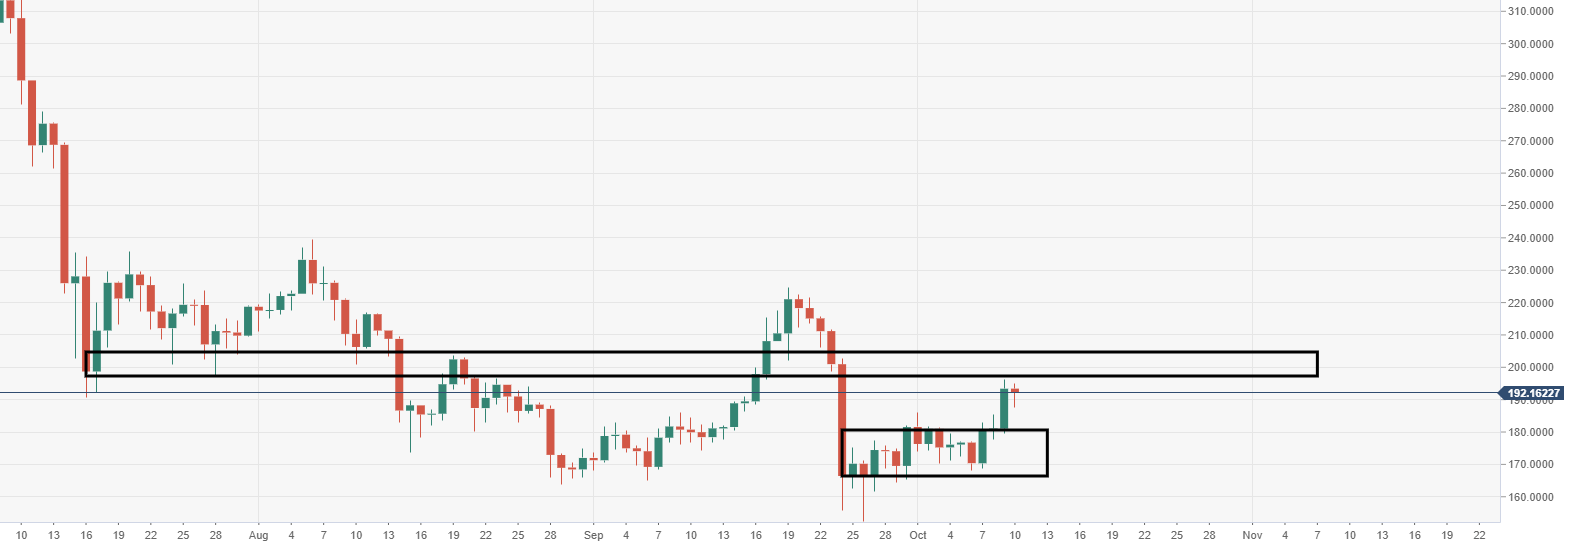
ETH/USD daily chart
The next barrier for the bulls to tackle is seen at the range of $200-205, the price may first be subject to a retest of the breached two-week range, down at $180.
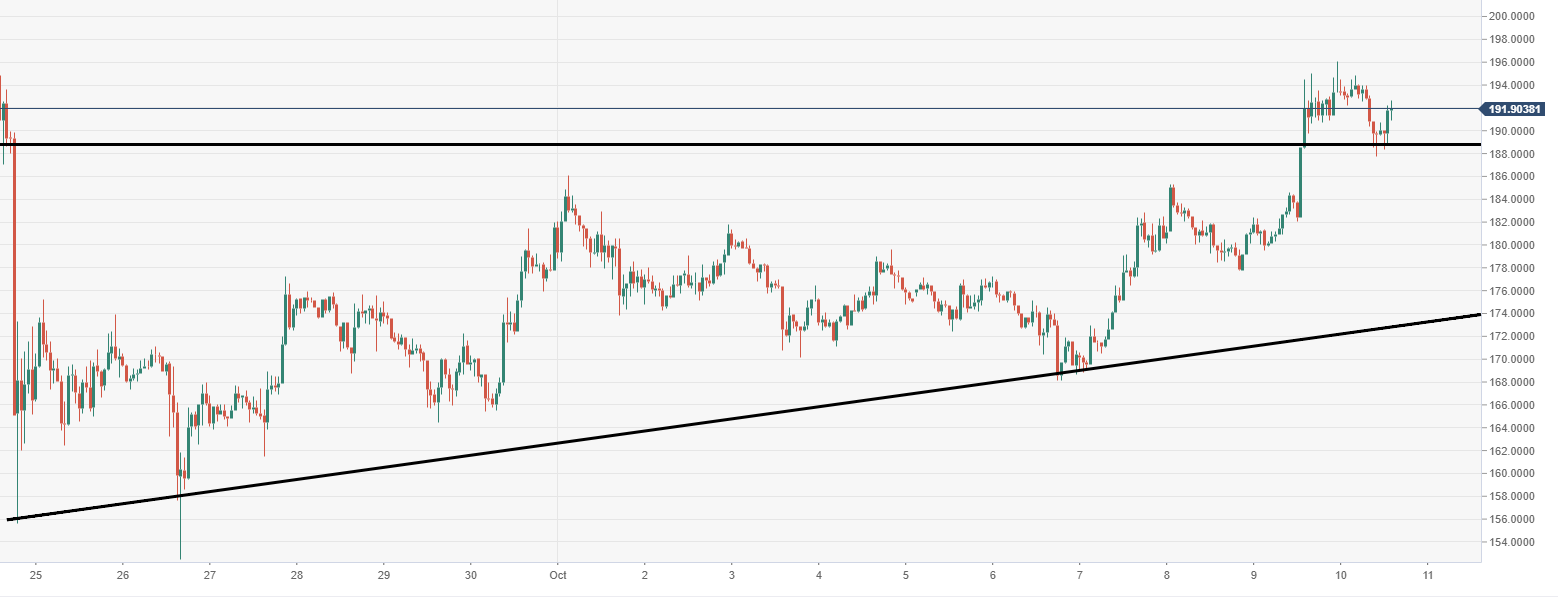
ETH/USD 60-minute chart
Important 60-minute support is observed at the $188 mark, failure to hold will invite a near-term wave of selling pressure.
Spot rate: 191.79
Relative change: -0.60%
High: 194.86
Low: 187.71
Image Sourced from Pixabay
© 2024 Benzinga.com. Benzinga does not provide investment advice. All rights reserved.
Comments
Loading...
Benzinga simplifies the market for smarter investing
Trade confidently with insights and alerts from analyst ratings, free reports and breaking news that affects the stocks you care about.
Join Now: Free!
Already a member?Sign in

