Aspiring forex traders will generally benefit from developing the ability to interpret and analyze market data. Among the tools and techniques available to currency traders to do this, candlestick chart patterns stand out as a testament to the art and science of chart-based technical analysis.
These unique formations appearing on candlestick forex charts provide valuable insights into market sentiment and dynamics, which can empower currency traders to make better trading decisions.
In this article, you'll learn how to get started using candlestick types in forex trading, including an exploration of their significance and the diverse types that every forex trader should be familiar with.
What are Candlestick Patterns in Forex Trading?
Candlestick charts are a popular charting technique commonly used in forex trading to depict the exchange rate movement of currency pairs over a specific period. They were derived from a Japanese trading method developed by legendary rice trader Munehisa Homma in the 18th century.
The useful candlestick trading patterns that appear on these charts capture the essence of forex market psychology and reveal key information about the ongoing battle between buyers and sellers. Each candlestick on a chart represents a specified timeframe that typically ranges from one minute to one month, depending on a particular trader's preferences.
By observing the shape, color and position of these candlesticks, forex traders can gain valuable insights into the likely future market direction, as well as about possible trend reversals and continuations. Such patterns can also generate potential trading opportunities, and they are especially useful when combined with and confirmed by other technical analysis methods.
What Do Candlestick Patterns Tell Forex Traders?
Candlestick patterns serve as a visual language that can communicate helpful market information to observant forex traders. By examining the body, wicks and position of each candlestick in a particular candle pattern, a trader can discern key currency market dynamics and more accurately anticipate a future exchange rate or price movement.
These patterns generally provide insights into the balance of power between buyers and sellers. They can also reflect the strength of a trend and the likelihood of a trend reversal. In addition, candlestick patterns offer clues regarding market indecision, accumulation, distribution and the emergence of new market trends.
Armed with the extra knowledge that candlestick patterns can offer those familiar with how to use them, forex traders can more effectively time their market entries and exits, manage their trading risk and enhance their overall profitability.
20 Top Candlestick Chart Patterns
These 20 patterns present unique insights into the prevailing market sentiment that can be useful to enhance your forex trading abilities and the accuracy of your market forecasts.
Keep in mind that many more candlestick patterns exist within each type in case you wish to broaden your exploration into this unusually fascinating technical analysis topic.
Bullish Candlestick Patterns
Bullish candlestick patterns signal a potential reversal or continuation of an upward exchange rate trend, indicating a shift in power from sellers to buyers. Some notable bullish candlestick patterns are explained in the sections below and a larger selection is shown in the following image.
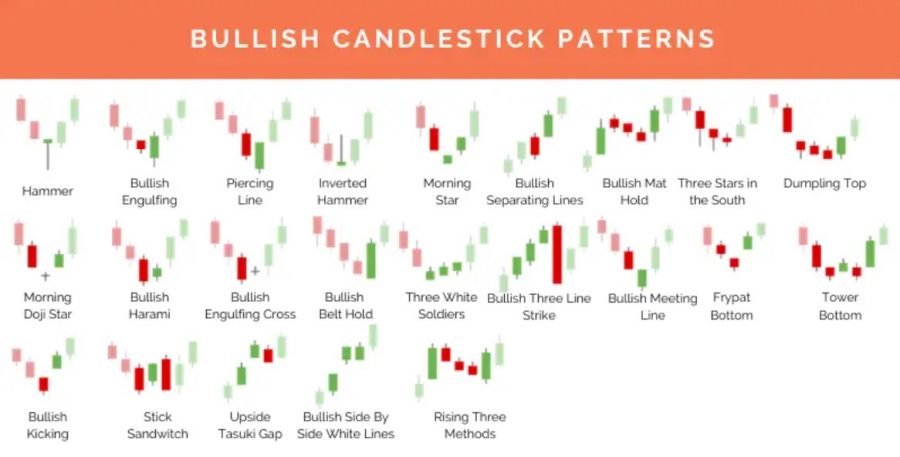
Diagrams of significant bullish candlestick patterns. Source: Alphaexcapital.
Hammer
The hammer is a bullish reversal pattern that signifies a potential trend reversal from a bearish to a bullish phase. It consists of a small body at the top of the candlestick with a long lower wick that resembles a hammer. This pattern suggests that buyers have regained control after a period of selling pressure, which indicates a potential buying opportunity for forex traders.
Inverted Hammer
The inverted hammer looks much like a shooting star, but it is instead a bullish reversal pattern that indicates a potential trend reversal to the upside when it is found at the bottom of a downtrend. It features a small body at the bottom of the candlestick with a long upper wick, creating an uptrend appearance similar to an inverted hammer. The inverted hammer suggests that buyers have regained control after a period of selling pressure, potentially leading to a bullish move.
Bullish Engulfing
The bullish engulfing pattern occurs when a small bearish candlestick is followed by a larger bullish candlestick that completely engulfs the previous candle's body. This pattern represents a shift in market sentiment from bearish to bullish, with buyers overpowering sellers. Traders often interpret this pattern as a strong bullish signal and look for potential buying opportunities.
Piercing Line
The piercing line is a bullish reversal candlestick chart pattern that appears after a significant downtrend. It consists of a bearish candlestick followed by a bullish candlestick with a closing price or exchange rate that penetrates at least halfway into the body of the previous bearish candlestick. This pattern suggests a potential trend reversal, indicating that buyers are gaining strength and the market sentiment is shifting to a more bullish outlook.
Morning Star
The morning star is a powerful bullish reversal pattern that consists of three candlesticks. It appears after a prolonged downtrend and begins with a long bearish candlestick, followed by a small bearish or bullish candlestick with a narrow range. The pattern concludes with a large bullish candlestick that closes near or above the midpoint of the first bearish candlestick. This pattern suggests a strong reversal in market sentiment, indicating a potential buying opportunity for traders.
Three White Soldiers
The three white soldiers pattern is a bullish continuation pattern that occurs during an uptrend. It consists of three consecutive bullish candlesticks with increasing closing exchange rates. This pattern suggests that buyers are in control and the uptrend is likely to continue, offering traders potential opportunities to ride the upward momentum.
Bearish Candlestick Patterns
Bearish candlestick patterns signal a potential reversal or continuation of a downward market trend, indicating a shift in power from buyers to sellers. Some significant bearish candlestick patterns are shown in the following image, a subset of which are explained further in the subsections below it.
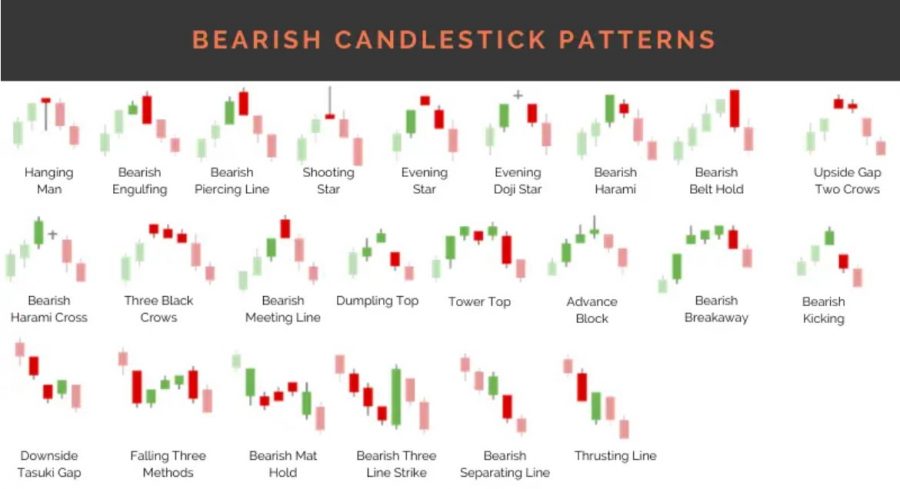
Diagrams of significant bearish candlestick patterns. Source: Alphaexcapital.
Hanging Man
The hanging man is a bearish reversal pattern that appears at the top of an uptrend. It consists of a small body at the top of the candlestick with a long lower wick, resembling a hanging man. This pattern suggests that sellers have regained control after a period of buying pressure, indicating a potential selling opportunity for traders.
Shooting Star
The shooting star is a bearish reversal pattern that looks like an inverted hammer but appears at the top of an uptrend. It features a small body at the bottom of the candlestick with a long upper wick, creating an appearance similar to a shooting star. The shooting star suggests that sellers have regained control after a period of buying pressure, potentially leading to a bearish move.
Bearish Engulfing
The bearish engulfing pattern is the opposite of the bullish engulfing pattern. It occurs when a small bullish candlestick is followed by a larger bearish candlestick that completely engulfs the previous candle's body. This pattern represents a shift in market sentiment from bullish to bearish, with sellers overpowering buyers. Traders often interpret this pattern as a strong bearish signal and look for potential selling opportunities.
Evening Star
The evening star is a bearish reversal pattern that mirrors the morning star pattern. It appears after a prolonged uptrend and begins with a long bullish candlestick, followed by a small bullish or bearish candlestick with a narrow range. The pattern concludes with a large bearish candlestick that closes near or below the midpoint of the first bullish candlestick. This pattern suggests a strong reversal in market sentiment, indicating a potential selling opportunity for traders.
Three Black Crows
The three black crows pattern is a bearish continuation pattern that occurs during a downtrend. It consists of three consecutive bearish candlesticks with decreasing closing exchange rates. This pattern suggests that sellers are in control and the downtrend is likely to continue, offering traders potential opportunities to capitalize on the downward momentum.
Dark Cloud Cover
The dark cloud cover is a bearish reversal pattern that appears after a significant uptrend. It consists of a bullish candlestick followed by a bearish candlestick with a closing exchange rate that penetrates at least halfway into the body of the previous bullish candlestick. This pattern suggests a potential trend reversal, indicating that sellers are gaining strength and the market sentiment is shifting to a more bearish outlook.
Neutral Candlestick Patterns
Neutral candlestick patterns tend to show up during a market consolidation phase, often indicating indecision among sellers and buyers and a general lack of direction in the market. While these patterns may not provide strong directional signals, they still offer valuable market insights to forex traders. Some notable neutral candlestick patterns are explained in the sections below and shown in the following image.
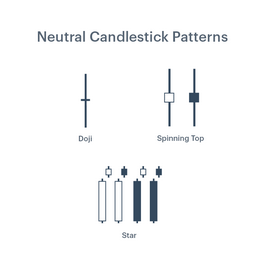
Diagrams of significant neutral candlestick patterns. Source: OptionAlpha.
Doji
The doji is a unique candlestick pattern that signifies market indecision. It occurs when the opening and closing exchange rates are virtually the same, resulting in a small or nonexistent body. Different types of dojis can appear on a chart, such as the neutral doji, gravestone doji, dragonfly doji, four-price doji and long-legged doji, and each doji candle has its own market implications. The appearance of a doji generally suggests that neither buyers nor sellers have gained control, representing a period of market equilibrium when traders are not collectively in agreement about the market’s future direction.
Spinning Top
The spinning top is another neutral candlestick pattern that features a small body and long upper and lower wicks of roughly equal length. It generally indicates that an indecisive struggle exists between buyers and sellers, with neither side gaining control. This pattern typically arises during a temporary pause in the prevailing trend and suggests a brief neutral consolidation phase is taking place before a continuation, sideways move or a potential reversal occurs, depending on the surrounding market context. Traders often interpret spinning tops as a sign of a potential shift in market sentiment, and they might also pay close attention to the subsequent candlestick to confirm the future direction of the market’s movement and look for confirmation from other technical indicators or patterns. For example, if a spinning top arises after an uptrend as part of a suspected downside reversal, the candle after the spinning top should be a bear or red candle. If not, the reversal is not confirmed, so traders should wait for another signal before entering the market.
Star
The star is a neutral pattern that consists of a small body and a significant gap in relation to the previous candlestick's body. The star indicates a temporary pause or indecision in the prevailing trend and suggests that the prevailing market move may be losing momentum. The star can be bullish or bearish, depending on the direction of the prevailing trend. Traders often view the appearance of a star pattern as a potential reversal signal or a sign that the market may be entering a period of consolidation.
Continuation Candlestick Patterns
Continuation candlestick patterns indicate a temporary pause or consolidation in the ongoing trend before the exchange rate resumes its prior direction and a wide range of them are shown in the following image. The three black crows pattern is a notable bearish candlestick continuation pattern that has already been described above, and additional continuation patterns are explained further in the subsections below.
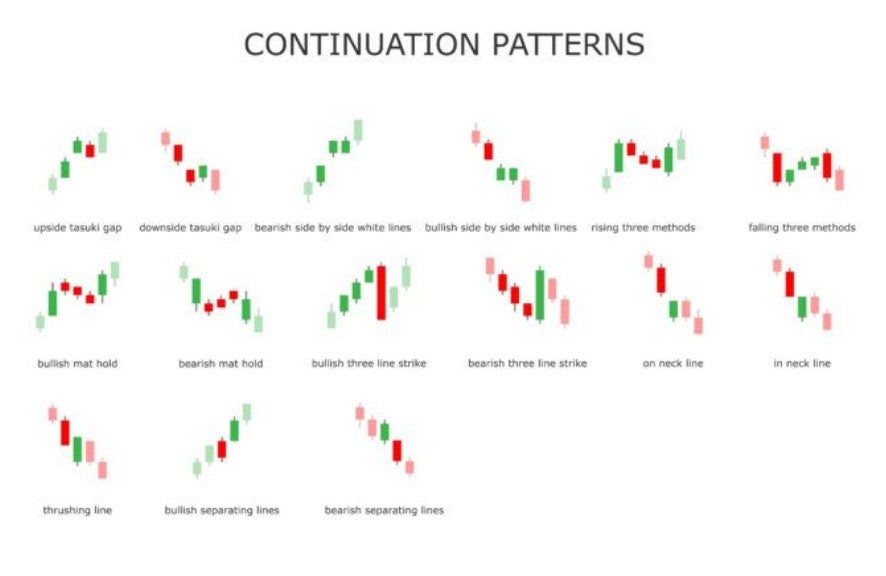
A summary of the significant continuation candlestick patterns. Source: m.iopshop.pw.
Falling Three Methods
The falling three methods is a continuation pattern that occurs during a downtrend. It consists of a long bearish candlestick followed by a series of small bullish candlesticks, commonly known as "flags," which drift lower within the range of the initial bearish candlestick. This pattern suggests that the market is taking a breather before continuing its downward movement, presenting potential trading opportunities for those anticipating the resumption of the downtrend.
Rising Three Methods
The rising three methods is the opposite of the falling three methods pattern. It occurs during an uptrend and features a long bullish candlestick followed by a series of small bearish candlesticks, or flags, which drift higher within the range of the initial bullish candlestick. This pattern suggests a temporary consolidation or pause in the uptrend before its potential continuation, offering traders opportunities to capitalize on the prevailing bullish sentiment.
Reversal Candlestick Patterns
Several significant candlestick patterns indicate potential trend reversals in the forex market. These reversal candlestick patterns provide traders with insights into the possibility of a shift in market sentiment and can help traders identify profitable trading opportunities.
Since traders usually interpret the appearance of such reversal candlestick patterns as significant signals for trend reversals, they will generally adjust their trading positions accordingly.
Some candlestick patterns that can portend market reversals have already been discussed in previous sections, and these include the bullish and bearish engulfing patterns, morning and evening stars, the hanging man, the spinning top and the dark cloud cover patterns.
A variety of notable reversal candlestick patterns are shown in the image below and several additional patterns are discussed in the following subsections.
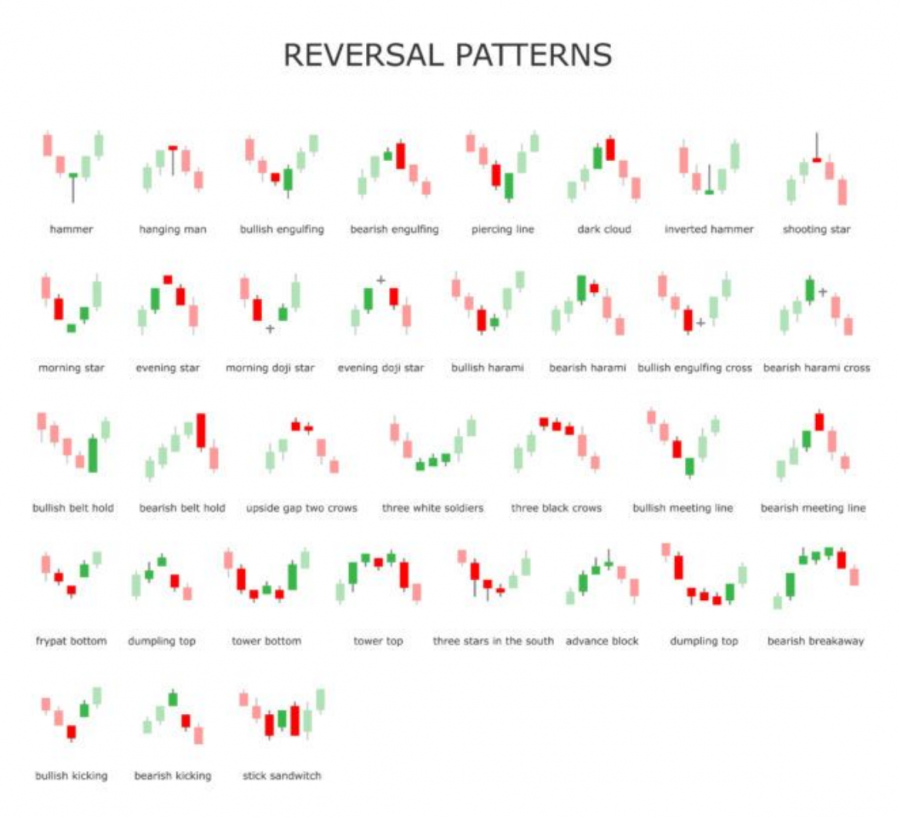
A summary of the significant reversal candlestick patterns. Source: m.iopshop.pw.
Harami
The harami pattern is a two-candlestick reversal pattern that denotes a potential trend reversal. It occurs when a large candlestick is followed by a smaller candlestick, which is entirely contained within the range of the previous candlestick. The harami pattern can be either bullish or bearish, depending on the direction of the market. A bullish harami suggests a potential reversal from a downtrend to an uptrend, while a bearish harami indicates a potential reversal from an uptrend to a downtrend.
Pin Bar
The pin bar, or Pinocchio bar, is a single-candlestick reversal pattern that can provide valuable insights into potential trend reversals. It features a long upper or lower wick, with a small body located at the opposite end of the wick. The wick represents the rejection of exchange rate levels, while the body reflects the closing exchange rate. A bullish pin bar suggests a potential reversal from a downtrend to an uptrend, while a bearish pin bar indicates a potential reversal from an uptrend to a downtrend.
Morning and Evening Doji Star
While the doji is often a neutral pattern itself, traders can interpret the appearance of this type of candle as a potential reversal signal when it appears as part of the morning or evening doji star pattern. The morning doji star is a bullish three-candle reversal pattern that looks like the morning star pattern. The only difference is that the morning doji star has a doji candle other than the four-price doji in the second candle’s position that should not have a market gap before or after it. The evening doji star is the bearish inverse of the morning doji star pattern and implies a downside reversal is likely.
Mastering Candlestick Patterns
Candlestick patterns can serve as powerful tools for forex traders, so they remain a handy element of the forex trading arsenal. These visual representations of exchange rate or price action offer valuable insights into market sentiment and provide helpful signals regarding trend reversals and continuations.
By mastering the interpretation and analysis of candlestick patterns, forex traders can enhance their trading strategies, identify potential trade setups, gain a deeper understanding of market dynamics, improve their trade timing and increase their chances of trading profitably.
Keep in mind, however, that candlestick patterns should not be used in isolation in a trading strategy but rather in conjunction with other technical analysis tools and indicators like trading volume and momentum oscillators. This knowledge will help you validate trade signals and confirm the strength of the candlestick patterns observed.
Frequently Asked Questions
Can candlestick patterns guarantee profitable forex trades?
While candlestick patterns can provide valuable insights into forex market dynamics, they do not guarantee profitable trades. Traders should also consider other factors such as market conditions, trend analysis, risk management and fundamental analysis to make the most accurate trading decisions.
How often do candlestick patterns occur on forex charts?
Candlestick patterns occur frequently on exchange rate charts since they reflect the constant battle between buyers and sellers that takes place on an ongoing basis in the massive forex market. The frequency of their occurrence can vary significantly depending on the pattern, currency pair, timeframe and market volatility involved.
How can I effectively incorporate candlestick patterns into my forex trading strategy?
To best incorporate candlestick patterns into your trading strategy, you will generally want to combine them with other technical indicators and tools, such as trend lines, support and resistance levels, momentum oscillators and moving averages. Performing this additional analysis can help you confirm candlestick patterns and increase the probability of making successful forex trades.
Get a Forex Pro on Your Side
FOREX.com, registered with the Commodity Futures Trading Commission (CFTC), lets you trade a wide range of forex markets with low pricing and spreads, fast, quality execution on every trade.
You can also tap into:
- EUR/USD as low as 0.0 with fixed $7 commissions per $100k USD traded
- Powerful, purpose-built currency trading platforms like MT4, MT5, TradingView, cTrader and NinjaTrader
- Monthly cash rebates with FOREX.com’s Active Trader Program
Learn more about FOREX.com powerful trading platform and how you can get started today.

About Jay and Julie Hawk
Jay and Julie Hawk are the married co-founders of TheFXperts, a provider of financial writing services particularly renowned for its coverage of forex-related topics. With over 40 years of collective trading expertise and more than 15 years of collaborative writing experience, the Hawks specialize in crafting insightful financial content on trading strategies, market analysis and online trading for a broad audience. While their prolific writing career includes seven books and contributions to numerous financial websites and newswires, much of their recent work was published at Benzinga.