In the dynamic world of forex trading, understanding chart patterns is crucial to making the right decisions. One widely used pattern in technical analysis is the consolidation pattern. Consolidation patterns occur when price movements temporarily enter a narrow range before resuming their trend. Recognizing and effectively trading these patterns can be valuable for traders looking to capitalize on potential breakouts.
In this guide, we'll explore various types of consolidation patterns, discusses strategies to trade them and provides an example to illustrate their application.
What is the Consolidation Pattern?
The consolidation pattern in forex is a chart pattern defined by sideways price movements within a range before a breakout in a new direction. It typically occurs when the market is indecisive, and neither the buyer nor seller have any control over the price.
During consolidation, the market pauses, forming recognizable patterns such as rectangles, triangles or wedges. These patterns often provide helpful clues about the future direction of the price once the consolidation phase is over. Traders can use these patterns to identify and exploit potential trading opportunities.
Types of Consolidation Patterns
Many types of consolidation patterns can form in the forex market, each with its own characteristics and implications. Here are some of the more common ones.
Symmetrical Triangles
Symmetrical triangles are consolidation patterns formed when the price makes lower highs and higher lows, creating a narrowing wedge shape. This pattern signifies a state of equilibrium caused by indecision between buyer and seller, with neither having a clear advantage.
Once it reaches its peak, the triangle usually precedes a breakout in either direction, depending on the prevailing trend. Traders can use this symmetrical triangle to anticipate the breakout and place their entry order accordingly.

Descending Triangles
Descending triangles are consolidation patterns that slope downward, formed by a horizontal support line and a descending trendline connecting the lower highs. This pattern suggests a potential bearish breakout below the support line as sellers become more aggressive while buyers struggle to maintain higher price levels. Traders can use the descending triangle to enter short positions once the price breaks below the support line.

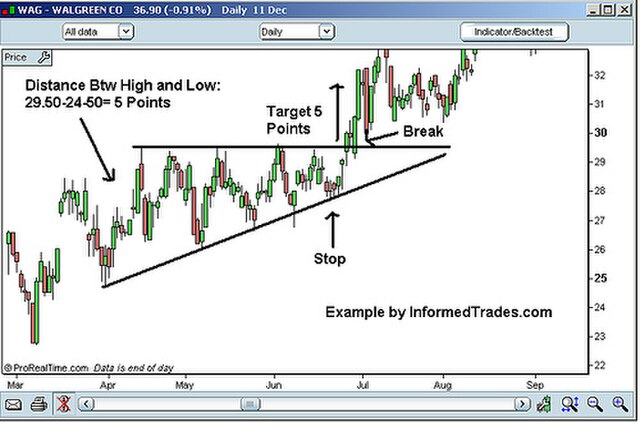
Ascending Triangles
Ascending triangles have an upward slope consisting of a horizontal resistance line and an ascending trendline connecting the higher lows. This pattern indicates potential bullish sentiment and that the price will likely break above the resistance line as buyers become more active while sellers struggle to push the price lower. It provides an opportunity for traders to enter long positions once the price breaks above the resistance line.
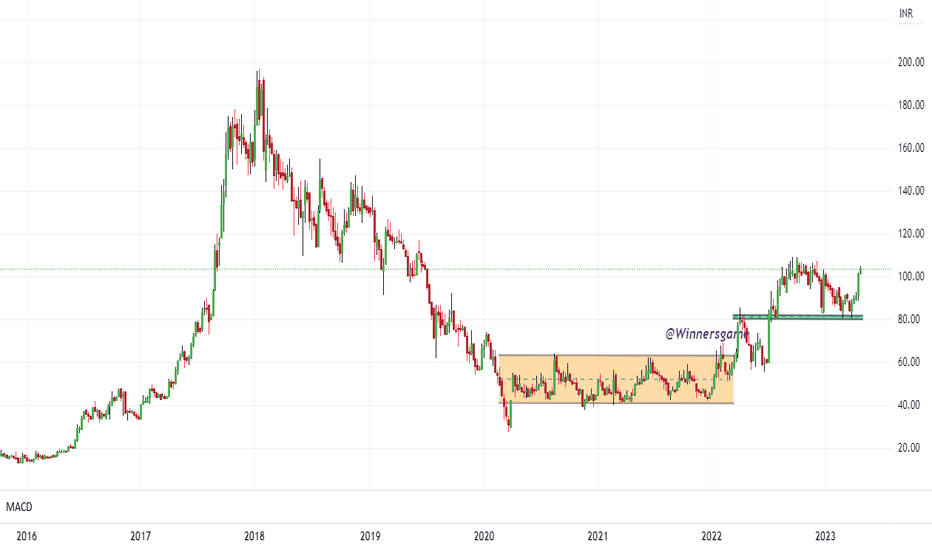
Ranges
Range consolidations occur when prices move within a defined support and resistance level, forming a horizontal trading range. Traders can identify range patterns by observing multiple swing highs and lows at similar price levels. This pattern implies that the market is indecisive, and neither buyers nor sellers have enough momentum to push the price out of the range. Traders can use the range to trade both sides of the market, buying at support and selling at resistance or waiting for a breakout in either direction.
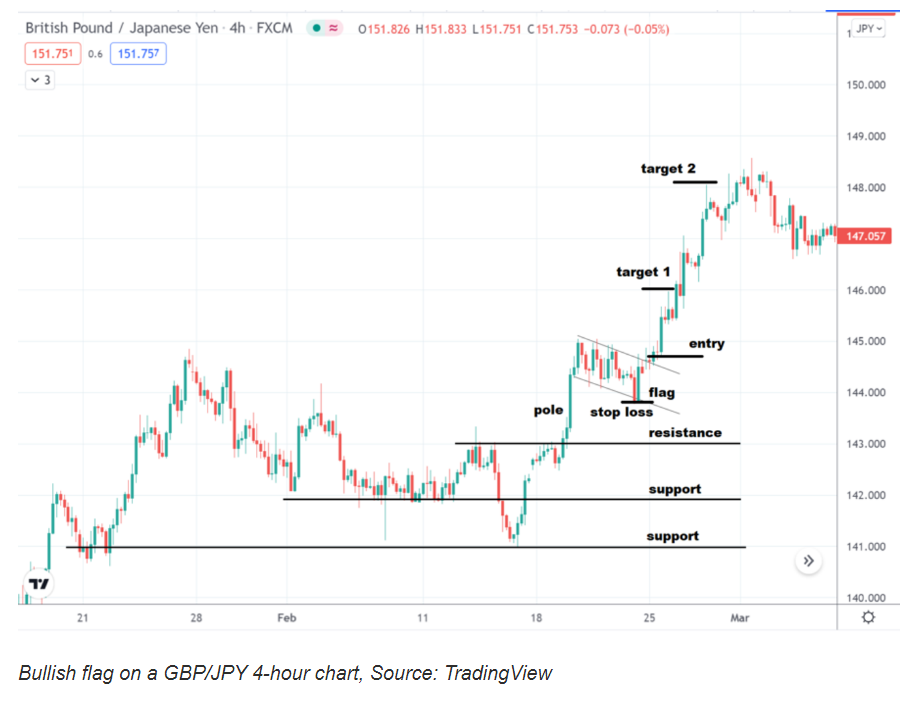
Rectangle or Flag Pattern
The rectangle or flag pattern is a consolidation pattern characterized by parallel trendlines forming a rectangle or flag shape. It develops when the price moves sideways in a narrow range after a sharp move up or down. These patterns typically occur after a significant price movement, indicating a period of consolidation before the trend continues. Traders can use the rectangle or flag pattern to enter positions aligned with the trend once the price breaks out of the range.
Trading the Consolidation Pattern in the Forex Market
Trading the consolidation pattern can be profitable if done correctly. Here are some tips.
Volume
Monitoring volume is an important aspect of trading consolidation patterns. As the consolidation progresses, volume tends to decrease, indicating decreasing market participation and potential indecision. However, a significant increase in volume during the breakout can confirm the strength and validity of the breakout. High volume during the breakout indicates strong participation and conviction from traders, which can increase the probability of a successful trade.
Size of the Consolidation
Analyzing the size of the consolidation can provide valuable insights into the potential for a breakout. While the size alone doesn’t determine the direction of the breakout, smaller consolidations may have a higher likelihood of breaking out in the direction of the original trend. Smaller consolidations indicate less accumulation or distribution of positions by traders, which can increase the probability of a continuation of the original trend. However, other factors such as volume, market conditions and technical indicators should also be considered when trading consolidation patterns.
Breakout Confirmation
A breakout confirmation is a signal that validates the direction of the breakout from the consolidation pattern. It can be a candlestick pattern, a chart pattern, a technical indicator or a combination. For example, a bullish engulfing candlestick pattern, a rising wedge chart pattern and a crossover of moving averages can confirm a bullish breakout from a consolidation pattern. A breakout confirmation should occur on high volume and with a clear price movement beyond the boundaries of the consolidation pattern.
Risk-Reward Ratio
As with any trading strategy, you should use a favorable risk-reward ratio when trading consolidation patterns. A good rule of thumb is to aim for at least 2:1, meaning your potential profit should be twice as large as your possible loss. You can use the pattern size to estimate your target and stop-loss levels.
Example of Trading the Consolidation Pattern
Let’s say you are looking at the EUR/USD currency pair on a 1-hour price chart. You notice the price moving sideways in a narrow range, forming a rectangle pattern. The volume during the consolidation phase is low, indicating a lack of interest from traders.
You decide to wait for a breakout confirmation before entering a trade. After several hours, the price breaks above the resistance line of the rectangle pattern on high volume, indicating strong buying pressure.
You enter a long position at the market price with a stop-loss order below the support line of the rectangle pattern. The price continues to move higher, confirming the breakout and reaching your profit target.
In this example, you have successfully traded the consolidation pattern by identifying the pattern, waiting for a confirmation of the breakout and managing your risk with a stop-loss order.
Profiting from Consolidation Patterns in Forex
Mastering the art of trading consolidation patterns in the forex market can be a valuable skill for traders. They can help you identify and trade breakouts in any market condition. You can enhance your trading results by understanding the different types of consolidation patterns, employing suitable strategies and managing risk effectively. Remember to continually refine your skills through practice and analysis, as the forex market offers numerous opportunities for those who can identify and navigate consolidation patterns.
Frequently Asked Questions
Is consolidation bullish or bearish?
Consolidation itself is neither bullish nor bearish but represents a period of market indecision. The subsequent breakout from the consolidation pattern determines the direction of the trend.
What is the bullish consolidation pattern?
A bullish consolidation pattern refers to a period of consolidation that occurs within an uptrend. It suggests a temporary pause before the upward trend potentially continues.
Should you trade during consolidation?
Trading during consolidation can be challenging as prices move within a narrow range. Many traders prefer to wait for a breakout from the consolidation pattern to confirm the direction before entering a trade.
Get a Forex Pro on Your Side
FOREX.com, registered with the Commodity Futures Trading Commission (CFTC), lets you trade a wide range of forex markets with low pricing and spreads, fast, quality execution on every trade.
You can also tap into:
- EUR/USD as low as 0.0 with fixed $7 commissions per $100k USD traded
- Powerful, purpose-built currency trading platforms like MT4, MT5, TradingView, cTrader and NinjaTrader
- Monthly cash rebates with FOREX.com’s Active Trader Program
Learn more about FOREX.com powerful trading platform and how you can get started today.

About Anna Yen
Anna Yen, CFA is an investment writer with over two decades of professional finance and writing experience in roles within JPMorgan and UBS derivatives, asset management, crypto, and Family Money Map. She specializes in writing about investment topics ranging from traditional asset classes and derivatives to alternatives like cryptocurrency and real estate. Her work has been published on sites like Quicken and the crypto exchange Bybit.