The doji candlestick pattern stands out as a powerful technical analysis tool for forex traders seeking valuable insights into market trends and potential reversals. This useful single-candle formation represents a period of market indecision that marks potential turning points.
In this article, we'll cover the various doji candles in detail, exploring their significance, types and how to identify them.
Key Takeaways
- A Doji candle indicates market indecision, where the opening and closing prices are nearly identical, often signaling potential trend reversals.
- There are several types of Doji candles, including the Neutral Doji, Long-Legged Doji, Gravestone Doji, and Dragonfly Doji, each reflecting different market sentiments.
- Doji candles can serve as trading signals, particularly when they appear after significant price movements, prompting traders to look for confirmation before making trades.
- To enhance trading effectiveness, traders often combine Doji patterns with other technical indicators, such as the RSI or MACD, for better confirmation of market trends.
How Does a Doji Candle Work?
In essence, a doji candlestick represents a period of equilibrium between buyers and sellers. It works well for forex traders as an indicator of indecisive market forces. Such an equilibrium state shows up on charts as a small-bodied candle, with the opening and closing exchange rates nearly identical or equal.
This results in a candle with a virtually non-existent or very thin body. Another distinctive feature of the doji candle is its long wicks, also known as shadows, which extend from both ends of the tiny body.
The significance of the doji candle lies in its ability to reveal market indecision, where neither the bulls nor the bears have the upper hand in the forex market. This momentary pause often occurs after a strong market movement.
The doji candle is neither bullish nor bearish when seen on a candlestick chart, and it can signify a potential reversal or a continuation of the existing trend. The doji candle acts as a key signal for traders to exercise caution and closely monitor subsequent market moves for greater insight into the forex market’s sentiment.
Types of Doji Candles and Candle Patterns
While the basic structure of a doji candle remains the same among the various types of doji candles, several variations exist on this single-candle pattern that can provide additional insights into forex market sentiment and potential outcomes. The following image shows the general appearance of the five individual doji candle types.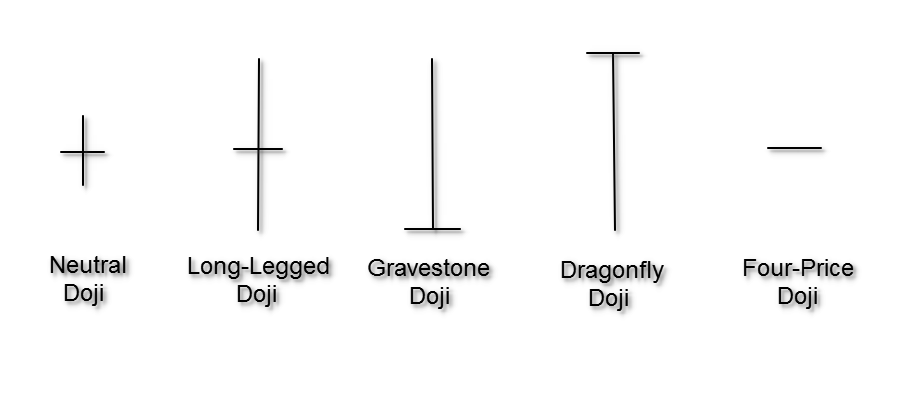
Diagram of the five common individual doji candle types. Source: ADigitalBlogger.com
The doji candle can also appear as part of a two-candle pattern that has useful predictive value for forex traders.
Each type of doji candle possesses its own unique characteristics and reflects specific forex market conditions and dynamics. Some of the most common variations on the doji candle and its most useful-two candle trading patterns include the:
- Neutral Doji: The neutral doji is also sometimes referred to as a common doji, and it generally represents market indecision. The single candle features a small body with upper and lower shadows of equal or almost equal length. The neutral doji suggests a temporary equilibrium between buyers and sellers, indicating a pause in market movement. Traders interpret this pattern as a potential reversal signal, with the subsequent candle likely determining the market's direction. The neutral doji is particularly valuable in identifying key support and resistance levels since it highlights areas where the balance of power may shift in the forex market.
- Long-Legged Doji: The long-legged doji or Rickshaw Man is characterized by both upper and lower shadows that are significantly longer than the body. This formation highlights heightened market indecision, and it often appears after a period of substantial volatility. While the long-legged doji does not provide a clear indication of the next exchange rate movement, it does serve as a warning sign for a potential trend reversal.
- Gravestone Doji: The gravestone doji is marked by a long upper shadow and a small or non-existent body near the low of the candle. It usually appears at the top of an uptrend, suggesting a possible reversal in favor of the bears. The extended upper shadow represents strong selling pressure and a potential shift in market sentiment.
- Dragonfly Doji: The dragonfly doji is characterized by its long lower shadow and the absence of an upper shadow. It often occurs at the bottom of a downtrend, indicating a possible trend reversal. This formation suggests that buyers have regained control after an extended period of selling pressure, so it hints at a potential bullish reversal.
- Four-Price Doji: The four-price doji, also known as a horizontal line doji, is a unique variation characterized by a small horizontal line instead of a traditional candlestick body. It occurs in the forex market when the opening, closing, high and low exchange rates are virtually identical. This formation signifies extreme market indecision, with neither the bulls nor the bears gaining an advantage. Traders often interpret the four-price doji as a potential turning point or a continuation of the current trend, depending on subsequent market action.
- Hammer Doji: A hammer doji is a two-candle pattern that forms when a dragonfly doji candle is followed by a strong bullish candlestick. As the name implies, the candle resembles a traditional hammer, with a small upper body and a long lower shadow. It usually appears at the bottom of a downtrend and signals a potential reversal in favor of the bulls. The long lower shadow represents strong buying pressure that pushes the exchange rate higher, which highlights the potential for a forthcoming upward trend.
- Bullish Doji Star: The bullish doji star is a two-candle pattern that contains a doji candle and occurs after a market decline. Its first candle has a black or red body and appears in a downtrend. The second candle is a doji candle that has its body situated below the first candle's body. Its appearance indicates diminishing bearish pressure and a possible trend reversal in favor of the bulls.
- Bearish Doji Star: The bearish doji star is a two-candle pattern that includes a doji and appears after a market rally. The first candle has a white or green body and appears in an uptrend. The second candle is a doji candle that has its body situated above the first candle's body. This formation suggests that bullish momentum is waning, which potentially signals a reversal in favor of the bears.
How to Identify a Doji Candlestick Pattern
Identifying a doji candlestick or two-candle pattern correctly requires attentiveness to the specific characteristics described in the previous section. To confirm the validity of a doji candle, traders will also often consider the preceding and succeeding candles.
In general, you will want to watch carefully for candles with thin or non-existent bodies and long shadows on both ends that characterize the doji class of candles. Remember that the length of the candle’s shadows and the absence of an upper or lower shadow can vary significantly depending on the type of doji candle involved and will help you identify the specific doji you are seeing on a chart.
Also, a doji candle appearing after a strong exchange rate movement or at a significant support or resistance level tends to add weight to its importance. Accordingly, observing subsequent market action is a key element of successfully determining the potential direction of the forex market after you identify a doji candle.
Example of Trading the Doji Candlestick Pattern
To illustrate the practical application of the doji candlestick pattern in forex trading, consider a trader who identifies a dragonfly doji candle forming at the bottom of a downtrend appearing on the EUR/USD exchange rate chart.
This formation suggests a potential reversal to the upside after a prolonged decline. In response, the trader decides to close out short positions and enter a long position in the EUR/USD currency pair since they now anticipate an upward movement in its exchange rate.
To manage their risk prudently, the trader puts a stop-loss sell order in the market just below the low of the dragonfly doji candle. They establish a target profit level based on key resistance levels they identify on the EUR/USD chart by looking for previous swing highs.
As the trading day unfolds, the exchange rate begins to rise, thereby validating the trader's bullish reversal analysis upon seeing the dragonfly doji appear. Eventually, the target profit level is reached, and the trader exits the trade to lock in a profit.
This example demonstrates how the dragonfly doji candlestick pattern can serve as an early indication of potential upside trend reversals. This pattern can offer forex traders valuable opportunities to enter and exit trading positions.
Trading Strategies Using Doji Candles
Now that the significance and types of doji candles have been explored, it is time to mention practical forex trading strategies that incorporate this powerful type of candlestick. By including doji candles in your forex trading arsenal, you can gain valuable insights into potential trend reversals and improve your overall trading performance.
Several effective strategies that use doji candles as key indicators will be discussed in the subsections below. Incorporating elements of these trading strategies into your own trading plan can help you enhance your forex trading toolkit.
Using Doji Candles for Trend Reversal Signals
One effective trading strategy involving doji candles focuses on using them to provide trend reversal signals. When a doji candle forms after a prolonged trend, it suggests a potential change in market sentiment. Traders can use the specific bullish or bearish doji star patterns described above as a signal to enter trades in the opposite direction of the prevailing trend. Keep in mind that it usually makes sense to wait for confirmation from subsequent market action and momentum indicators before committing to a market reversal trade.
Identifying Long-Legged Doji Patterns As Potential Reversals
The appearance of a long-legged doji pattern often indicates increased market indecision and portends a potential reversal after a period of significant market volatility. Traders can use these easily-recognizable candles as early warnings for trend changes and market exhaustion. When a long-legged doji appears after a prolonged trend, it makes sense to closely monitor subsequent forex market action and consider adjusting your trading strategies accordingly.
Combining Doji Candles With Other Technical Indicators for Confirmation
To enhance the reliability of doji candle signals, technical traders will often combine them with other technical indicators. For instance, they might look for confirmation from a momentum oscillator like the Relative Strength Index (RSI) or the Moving Average Convergence Divergence (MACD) indicator. By integrating multiple indicators into their trading strategy, forex traders gain a more comprehensive view of market conditions and thus can increase the likelihood of making successful trades.
Using Engulfing Patterns or Breakouts to Validate Doji Indications
Engulfing patterns and breakouts can serve as powerful tools to validate doji candlestick patterns. An engulfing pattern occurs when a candle completely engulfs the previous candle, indicating a potential shift in market sentiment. As an example of their use, forex traders can look for an engulfing pattern following a doji candle to confirm a reversal signal. Similarly, the occurrence of breakouts above or below key levels of support or resistance can provide additional confirmation of a doji candle's significance. They can also give an observant trader a sense of which direction the market has decided to pursue after its moment of indecision that formed the doji candle.
Determining Profit Targets With the Help of Doji Formations
When using the doji candlestick pattern to trade forex, profit targets will often be set after key support and resistance levels have been identified on an exchange rate chart. By looking closely for previous swing highs or lows and key areas of market congestion, forex traders can better establish realistic profit targets for their trading positions. Also, incorporating trailing stop-loss orders into a trading strategy can help protect profits and capture exchange rate movements that extend beyond a trader’s initial expectations.
Can Forex Traders Benefit from Using Doji Candles?
Doji candles can definitely serve as invaluable tools for technical forex traders seeking to interpret market sentiment and identify potential reversals. The ability of these easy-to-identify candles to convey currency market indecision and provide early signals for trend changes can make them a useful component of virtually any forex trader’s technical analysis methodology.
Still, no single indicator guarantees success in forex trading, so traders should use doji candles in conjunction with other technical tools and exercise proper risk and money management methods to maximize their effectiveness and provide the best chances of success when operating in the forex market.
Frequently Asked Questions
Is the doji candle bullish or bearish?
The doji candle does not inherently carry a bullish or bearish bias. The appearance of a doji candle typically represents market indecision, so it can signify both a potential reversal or a continuation of an existing trend.
What does a bullish doji indicate?
While a doji by itself is considered a neutral candle, a bullish doji star is a two-candle pattern that contains a doji candle and occurs after a market decline. The first candle appears in a downtrend and has a black or red body. The second doji candle has its tiny body entirely located below the first candle’s body. A bullish doji star indicates diminishing bearish pressure and a possible trend reversal to the upside.
What is a doji in an uptrend?
A doji in an uptrend signifies market indecision and a possible weakening of the bullish momentum. Overall, this is a neutral event that either implies a downside reversal in favor of the bears may be forthcoming or the market may continue rising after taking a breather.
Get a Forex Pro on Your Side
FOREX.com, registered with the Commodity Futures Trading Commission (CFTC), lets you trade a wide range of forex markets with low pricing and spreads, fast, quality execution on every trade.
You can also tap into:
- EUR/USD as low as 0.0 with fixed $7 commissions per 100,000
- Powerful, purpose-built currency trading platforms like MT4, MT5, TradingView and NinjaTrader
- Monthly cash rebates with FOREX.com’s Active Trader Program
Learn more about FOREX.com powerful trading platform and how you can get started today.

About Jay and Julie Hawk
Jay and Julie Hawk are the married co-founders of TheFXperts, a provider of financial writing services particularly renowned for its coverage of forex-related topics. With over 40 years of collective trading expertise and more than 15 years of collaborative writing experience, the Hawks specialize in crafting insightful financial content on trading strategies, market analysis and online trading for a broad audience. While their prolific writing career includes seven books and contributions to numerous financial websites and newswires, much of their recent work was published at Benzinga.