Forex trading offers significant potential for financial growth and has captivated the interest of traders worldwide in recent years. Among the multitude of technical analysis tools available to forex traders, the hammer candlestick pattern stands out for its simplicity and reliability.
The hammer candlestick pattern is used by seasoned professionals and novice traders. Derived from Japanese candlestick chart analysis methods, this single candle pattern exhibits a distinct shape with a long lower shadow and a short body located at the top that resembles a hammer. The hammer tends to occur at the end of a trend and signifies a potential reversal in the forex market.
In this article, we cover what the hammer candlestick pattern is and provide practical insights on how to effectively trade forex using this invaluable technical trading tool.
What is a Hammer Candlestick?
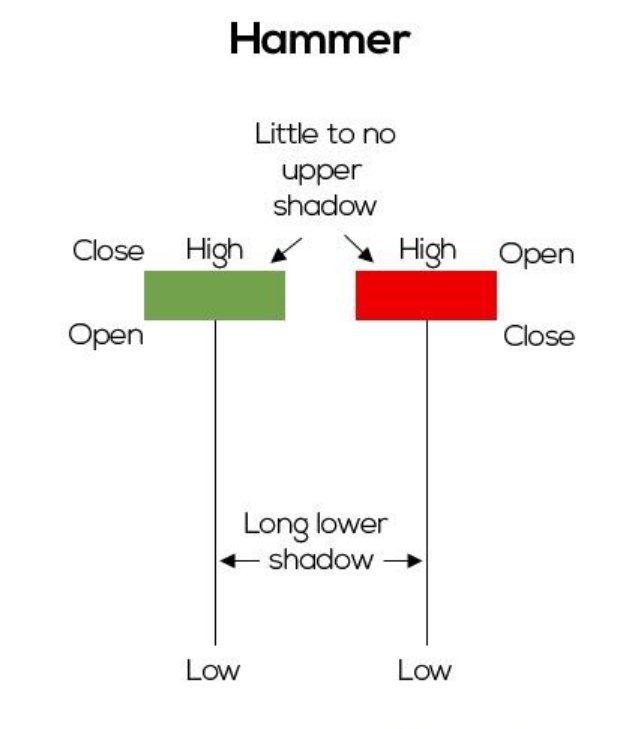
A hammer candle or candlestick is a widely recognized chart pattern that can be used by forex traders to identify potential bullish or bearish trend reversals. This type of individual candle is formed when the exchange rate of a currency pair opens near its high, experiences a significant decline during the timeframe of the candle and then rallies to close near its opening level. The resulting candlestick shape resembles a hammer, with a small body located at the top and a long lower shadow situated below it.
The significance of the hammer candlestick that arises after a downtrend lies in its potential to indicate a bullish shift in market sentiment. It suggests that buyers have stepped in after a period of prolonged selling pressure, leading to a possible corrective reversal of the prior decline. Forex traders typically interpret such hammer candlesticks as a bullish signal that indicates any shorts should be covered and going long to profit from an upwards correction may make sense.
On the other hand, if a hammer candlestick shows up after an uptrend, then it indicates a bearish shift in market sentiment and may be called a hanging man candle. Its appearance suggests that sellers have regained control of the market after an extended selling phase, leading to a possible downside correction of the prior rise. Forex traders typically interpret hanging man candlesticks as a bearish signal that indicates any longs should be covered and that it may make sense to go short to profit from a forthcoming downward correction.
When identifying a hammer candlestick on an exchange rate chart, you will generally want to consider its broader market movement context and analyze other technical indicators for confirmation before taking a position based on this formation. By incorporating the hammer candlestick pattern into your forex market analysis, you can gain valuable insights into market dynamics and make better trading decisions.
How to Identify the Hammer Candlestick When Trading Forex
Identifying a hammer candlestick pattern on an exchange rate chart can help you recognize potential trend reversals and profit from that observation. To identify a hammer candlestick, traders should look for a candlestick where the exchange rate opened near its high, experienced a decline and then rallied to close near its opening level.
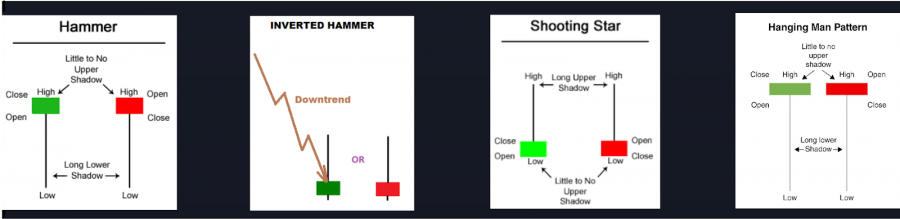
The following sections describe how to observe the distinct shape and characteristics of the hammer candle and other related candlestick patterns to enhance your ability to spot potentially profitable forex trading opportunities. Schematics of these four candle types appear in the image below.
Bullish Hammer
A bullish hammer candlestick pattern is formed on forex charts when the exchange rate of a currency pair opens near its high, experiences a significant decline during the trading session and then rallies to close near its opening level. This pattern occurs after a downtrend and indicates a possible bullish price reversal, with buyers stepping in after a prolonged period of selling pressure. Traders can identify a bullish hammer candlestick by looking for a small body at the top and a long lower shadow. This pattern suggests a buying opportunity and can be a valuable signal for forex traders to consider when making their trading decisions.
Bearish Hammer (Hanging Man)
The bearish hammer is more commonly known as a hanging man candlestick and is a bearish reversal signal commonly observed on forex candlestick charts after a prolonged rally. It looks just like a bullish hammer candlestick but appears after a market rise instead of after a fall. A hanging man candle is formed when the exchange rate opens near its high, experiences a significant drop but then rises to close near its opening level. This market action creates a small body at the top and a long lower shadow, and it suggests a potential trend reversal from bullish to bearish. The hanging man candle indicates that sellers might be gaining control of the market. When forex traders spot a hanging man candle, it may signal a potential selling opportunity and the start of a corrective downtrend.
Bullish Inverted Hammer
The bullish inverted hammer candlestick pattern, also known as the inverse hammer, is a significant candlestick chart signal for forex traders. This type of candle commonly appears at the bottom of a downtrend and indicates the potential for a bullish reversal. Its name derives from its distinctive shape that resembles an upside-down hammer. To identify an inverted hammer candle, traders should look for a long upper wick, a short lower wick and a small body at the bottom of the candle. It typically emerges when buyers exert pressure to drive the exchange rate of a currency pair higher.
Bearish Inverted Hammer (Shooting Star)
The bearish inverted hammer candle is also known as a shooting star. It looks just like the bullish inverted hammer candle, but it serves as a bearish reversal signal after an uptrend that suggests sellers may be gaining control of the market. A shooting star candle forms when a currency pair’s exchange rate opens near its high and experiences a significant rally but then declines to close near its opening level. This move creates a candle with a small body at the top and a long upper shadow. Forex traders identifying a bearish inverted hammer or shooting star candle should see it as a possible selling opportunity since it signals the initiation of a downtrend.
Example of How to Use a Hammer Candlestick
As an example of trading forex using the hammer candlestick pattern, consider a scenario where a trader spots a hammer candlestick on the daily chart for the EUR/USD currency pair. They note that the hammer forms after a prolonged downtrend, indicating a potential upside reversal and a bullish shift in market sentiment.
A trader could take the following steps to use a hammer candlestick to their advantage:
- Identify the hammer candlestick: Confirm that the candlestick has a small body at the top and a long lower shadow to make sure it qualifies as a hammer candle. The open exchange rate should be near the high, followed by a significant decline and then a rally toward the opening level.
- Confirm the signal: While the hammer candle alone suggests a potential upside reversal if it arises after a downtrend, it would be wise to seek confirmation from other technical indicators or chart patterns. Look for bullish signs such as bullish divergence in oversold territory on momentum oscillators like the Relative Strength Index (RSI) or a break above a key resistance level.
- Entry point: Now consider covering any shorts and entering into a long position by buying the currency pair. It may make sense to enter the market immediately at the close of the hammer candle or to wait for a subsequent bullish candle to confirm the upside reversal.
- Set stop loss and take profit levels: To manage risk wisely, it would be prudent to set a stop-loss order below the low of the hammer candlestick. This level acts as a safeguard if the market reverses sufficiently against your position to make the bullish signal fail. Also, determine a take-profit level based on nearby resistance levels or by using a risk-reward ratio that aligns with your trading strategy.
- Use money management: Ensure that the position size taken aligns with your money management method. Also, consider trailing your stop loss higher as the trade progressively moves in the money to help secure any accrued profits and protect them against adverse exchange rate movements.
- Monitor the trade: Continuously monitor the trade and adjust the exit strategy if needed. If the exchange rate moves favorably, consider adjusting the stop loss to at or above the trade’s breakeven level to lock in partial profits.
Keep in mind that trading based solely on candlestick patterns carries inherent risks. Accordingly, it generally seems best to combine a sighting of a hammer candle with confirmation from other technical analysis tools and fundamental factors to increase your chances of a successful trade.
Hammer Candlestick vs. Doji
You may be curious as to how a hammer candle compares and contrasts with a doji candle. While both candle types provide valuable information for forex traders, the appearance of a hammer candlestick suggests a potential market reversal, while a doji candle indicates indecision in the market.
The following sections contain bullet points that highlight the characteristics of the hammer versus doji candles.
Hammer Candlestick
- It consists of a single candle that typically appears after a downtrend and signifies a potential bullish reversal.
- It has a small body located at the top and a long lower shadow, resembling a hammer.
- The open exchange rate is near the high, followed by a significant decline and a rally toward the opening level.
- Its appearance suggests that buyers have stepped in, indicating a shift in market sentiment and a potential buying opportunity.
- Traders often seek confirmation from other technical indicators or chart patterns before entering a trade based solely on the hammer candlestick.
- Stop-loss orders are typically placed below the low of the hammer candle, and take-profit levels are determined based on nearby resistance or risk-reward ratios.
Doji Candlestick
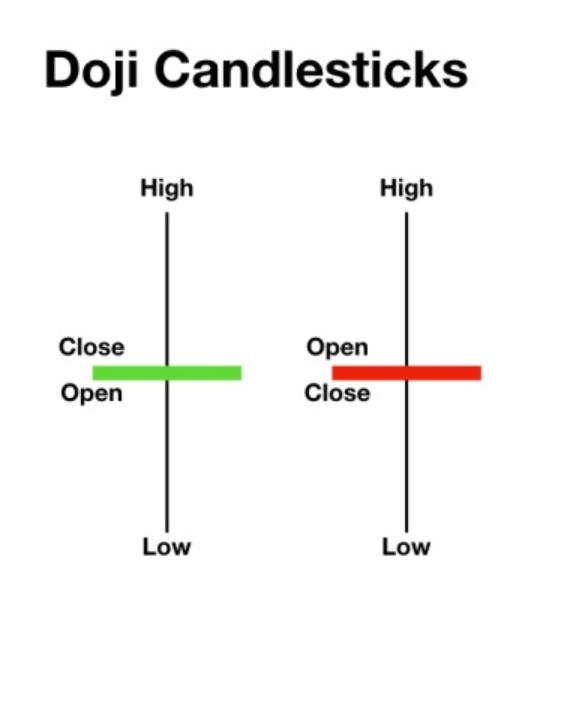
- The doji candlestick is a single candle that occurs when the opening and closing price or exchange rate levels are nearly identical, resulting in a very small body.
- It indicates indecision and a balance between buyers and sellers in the market.
- Different types of doji candles exist, such as the long-legged doji, gravestone doji and dragonfly doji, each with slight variations in their shape and market implications.
- The appearance of a doji candle suggests that a trend may be losing momentum or that a reversal could be imminent.
- Traders often look for confirmation signals, such as trendline breaks or support and resistance levels, to determine the direction of the next move after a doji appears.
- Stop-loss and take-profit levels can be determined based on nearby support and resistance levels or through the use of technical indicators.
Traders should use hammer and doji candles as part of a comprehensive trading strategy that incorporates confirmation signals and considers the broader market context to increase the probability of making successful trades based on them.
Should You Use Hammer Candlesticks to Trade Forex?
Hammer candlesticks can serve as a valuable tool to help forex traders identify potential bullish market reversals and capture profitable opportunities. With that noted, it remains important to exercise caution and consider additional factors in your overall strategy instead of basing trading decisions solely on this pattern.
Basically, while hammer candlesticks offer valuable insights into market sentiment, their reliability increases when confirmed by other technical indicators, such as trendlines, nearby support and resistance levels and momentum oscillators. Traders should also take into account the overall market context, including trading volume, market volatility and fundamental factors when initiating positions based on the appearance of a hammer candle.
By incorporating the hammer candlestick pattern within a comprehensive trading strategy, you can harness its potential and increase your chances of success when trading currencies. Also, keep in mind that performing a thorough market analysis and using prudent risk and money management methods remain essential components of a successful forex trading approach.
Frequently Asked Questions
Can forex hammer candlesticks be either bullish or bearish?
A hammer candlestick pattern is typically considered a bullish reversal signal, although it looks just like a bearish hanging man candle, characterized by a small body at the top and a long lower shadow. In contrast to a bearish hanging man candle that shows up after a rally, a bullish hammer occurs after a market decline. This pattern indicates that buyers have stepped in after a decline, potentially signaling a shift in market sentiment toward bullishness.
Can hammer candlesticks occur in a ranging market?
Yes, hammer candlesticks can occur in a ranging market. While hammer candlesticks are commonly used to signal potential bullish reversals after a downtrend, they can also appear in ranging market conditions. In a ranging market that moves sideways within a defined range without a clear trend, hammer candlesticks may indicate a temporary pause or consolidation. Since even a ranging market can display periods of rising and falling price action, hammers may show up when the market has been falling and is due to rise correctively within its trading range.
How reliable is a hammer candlestick?
While the hammer candlestick arising after a downtrend is widely recognized as a reliable potential bullish reversal signal, whether to trade on it or not should be assessed in the context of the overall market conditions and corroborating technical indicators. Taking into account additional factors such as volume, trend strength, market momentum and the presence of nearby support or resistance levels can enhance the pattern’s reliability in practice. Also, higher timeframes tend to provide more reliable hammer candle signals compared to lower timeframes.
Get a Forex Pro on Your Side
FOREX.com, registered with the Commodity Futures Trading Commission (CFTC), lets you trade a wide range of forex markets with low pricing and spreads, fast, quality execution on every trade.
You can also tap into:
- EUR/USD as low as 0.0 with fixed $7 commissions per $100k USD traded
- Powerful, purpose-built currency trading platforms like MT4, MT5, TradingView, cTrader and NinjaTrader
- Monthly cash rebates with FOREX.com’s Active Trader Program
Learn more about FOREX.com powerful trading platform and how you can get started today.

About Jay and Julie Hawk
Jay and Julie Hawk are the married co-founders of TheFXperts, a provider of financial writing services particularly renowned for its coverage of forex-related topics. With over 40 years of collective trading expertise and more than 15 years of collaborative writing experience, the Hawks specialize in crafting insightful financial content on trading strategies, market analysis and online trading for a broad audience. While their prolific writing career includes seven books and contributions to numerous financial websites and newswires, much of their recent work was published at Benzinga.