In today's financial world, the saying "knowledge is power" applies more to investors and traders than ever before. Understanding how to read stock charts is an important part of technical analysis. It has become essential for any risk-taker looking to achieve long-term success in the financial markets. For example, it helps to know how to read Robinhood charts if you've put all your eggs in the Robinhood basket. Moreover, understanding a range of charts helps you see more aspects of the market that the average retail trader would not see.
Knowing how to read stock charts and interpret their data opens up various intraday and swing trading opportunities for traders. Investors can also quickly peruse a chart to assess how a stock has performed over a specific period to understand better how the stock might perform in the future. If you're new to trading or investing, learning to read a stock chart as part of technical analysis can provide a solid foundation for forecasting future price action even in turbulent times.
- What are Stock Charts?
- Line Charts
- Bar Charts
- See All 24 Items
What are Stock Charts?
A stock chart is a graphic depiction of the price of a stock and how its price has changed over a certain period. It's generally drawn on a grid and provides details on the current price and historical price changes. At the same time, it can include information such as volume and the company's financial information. The chart's horizontal or X-axis shows the dates of price observations in order further from the present as you move your eyes left.
The chart's vertical or Y-axis shows the stock price level that increases when looking upward and decreases when looking downward. A stock chart will often include technical indicators in a box below the price action and price action overlays like a moving average (MA) of the price taken over a certain number of days.

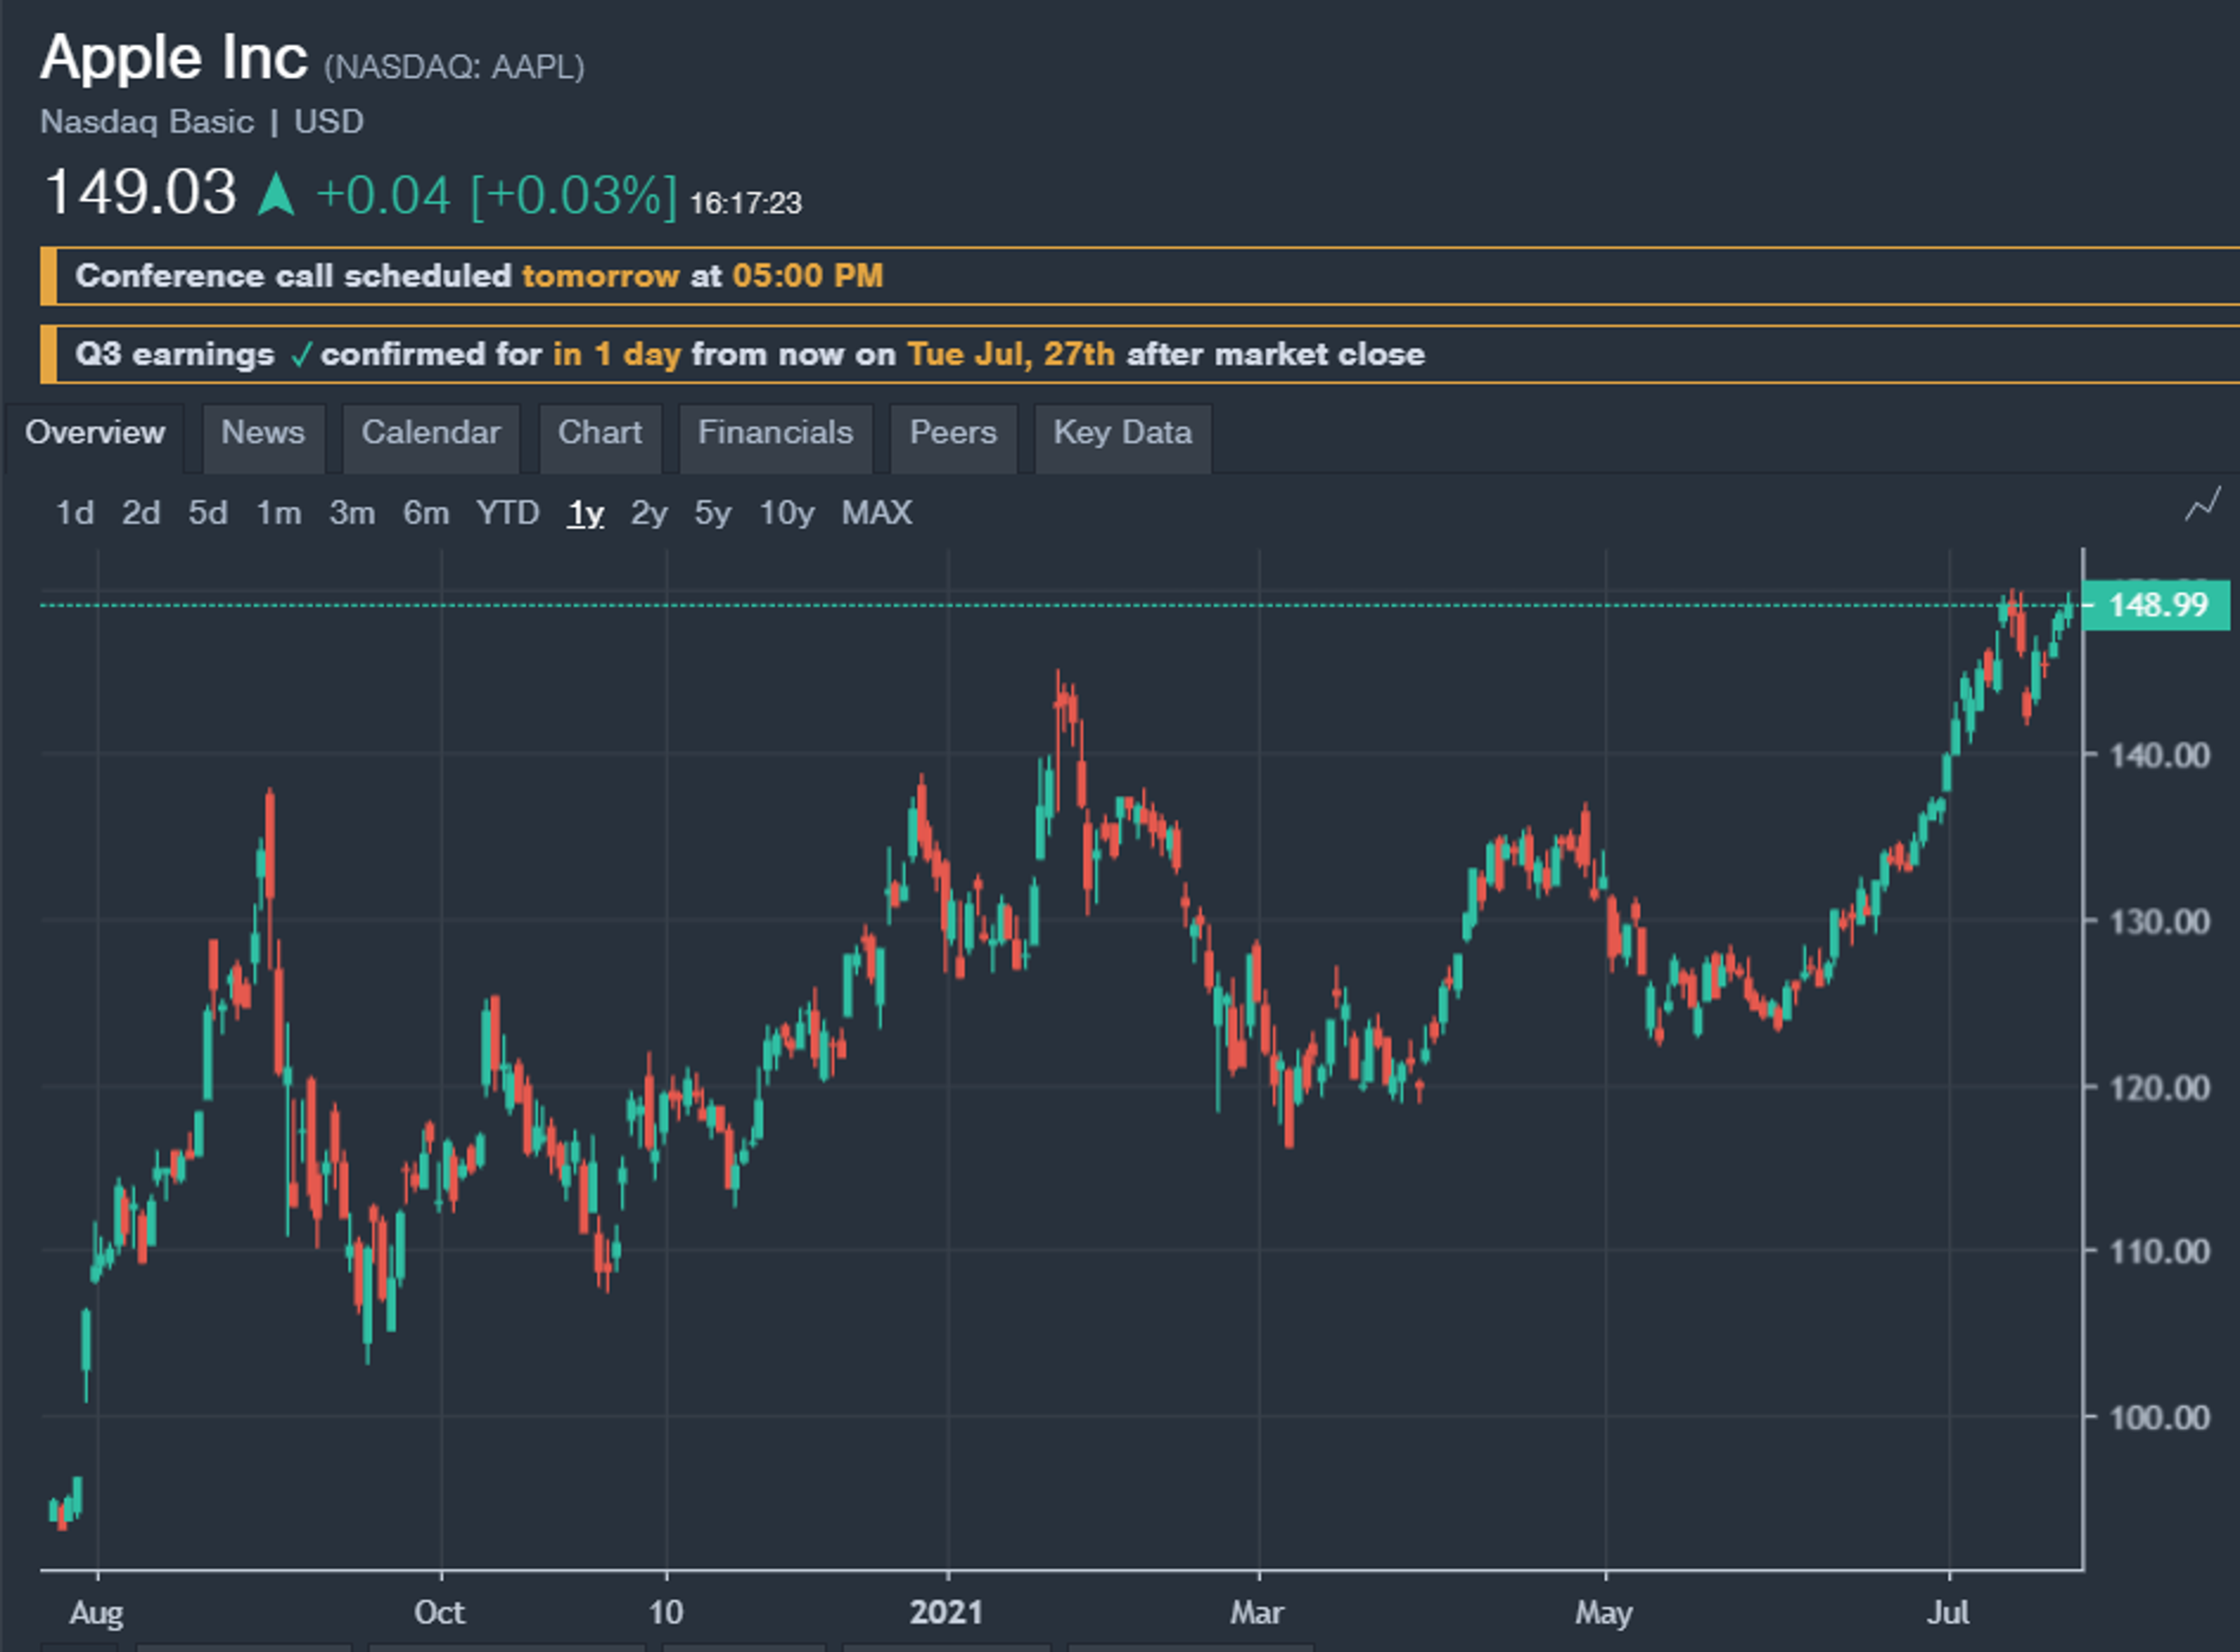
This example of a stock chart depicts the price of Apple Inc. (AAPL). It includes a 20-period MA drawn in red and superimposed over the price action and blue dots from the parabolic SAR indicator that gives trading signals intended to reflect short-term accumulation and distribution activity in the stock. The trading volume figures per period appear in light red and green along the bottom of the chart, with their 20-period MA shown in orange. The circled E and D letters along the bottom represent the stock's ex-dividend and dividend payments each quarter.
Most stock charts depict the price of a stock in these basic ways:
Line Charts
This straightforward type of chart shows the price, as, you guessed it, a line, at any given point during its trading day, typically the closing price, with a single point. Each price point is connected to adjacent prices with lines.
Bar Charts
The more sophisticated bar chart shows the range of the stock for the period charted by drawing a vertical line or "bar" from its high to its low price. A horizontal "flag" is then drawn to the left and to the right at the opening and closing stock price levels respectively.
Candlestick Charts
Invented in Japan, the candlestick chart is packed with even more information than a bar chart. The color of each candlestick indicates whether the stock's price closed up or down for the period. White and black or green and red are the most popular color schemes, with white or green for up periods and black or red for down periods.
The candle's "body" shows the range of the stock price from open to close, while two wicks extend from the top and bottom of the candle's body showing the upper and lower levels of the stock's price range. Interpreting candlestick charts according to the traditional Japanese system evolved over centuries of market observation lies outside the scope of this introduction. However, it is worth researching to help boost your forecasting abilities.
After reviewing the different types of stock charts, one thing becomes clear. An essential component of understanding how to read stock charts is knowing which chart you prefer.
How Stock Charts Work?
Stock charts are important tools for showing price movements over time. The vertical axis shows stock prices. The horizontal axis shows time increments, which can vary from minutes to years. There are different types of charts. Line charts connect closing prices. Bar and candlestick charts offer more details, like opening, closing, high, and low prices for each time period. Traders use stock charts with technical indicators, such as moving averages, volume, and relative strength index (RSI). They look for patterns that may indicate future performance. By analyzing these charts, traders can make informed decisions about buying or selling stocks. In short, stock charts help traders understand market sentiment and price action. They guide investors through the complexities of trading.
Why Should You Use Stock Charts?
Stock charts are important tools for investors. They show a stock's price movements over time. Both new and experienced traders can use these charts. They help identify trends and assess past performance. This information can aid in predicting future market behavior. Stock charts simplify complex data into easy-to-read formats. They highlight key patterns and indicators for buying or selling opportunities. Understanding stock charts can improve decision-making and investment strategies. As financial markets change, using stock charts is key for successful trading and investing today.
Visualize Market Trends
Stock charts help visualize market trends clearly. They cover various time frames, from minutes to years. By using graphs, charts show price movements, volume, and volatility quickly. This makes complex data easier to understand for both new and experienced investors. For example, a line chart displays a stock’s price changes over time. Candlestick charts provide more details, showing opening, closing, high, and low prices during specific periods. Investors can spot patterns in these visuals. This can help them identify potential buying or selling opportunities. It allows them to react to market changes effectively.
Technical Analysis
Stock charts are essential for technical analysis. They help evaluate historical price data to predict future price movements. Investors look at patterns like head and shoulders, double tops, and triangles to spot potential trend reversals or continuations. Charts also show important support and resistance levels. These levels indicate where prices may change direction. They are vital for setting stop-loss orders and take-profit targets. Furthermore, charts can include various technical indicators such as moving averages, Bollinger Bands, and the Relative Strength Index (RSI). Using these indicators helps investors understand market momentum, recognize overbought or oversold conditions, and assess trend strength. This enhances investment strategies and decision-making.
Improve Timing
Timing is important in investing. Stock charts help investors make timely decisions. By analyzing price patterns and trends, investors can find optimal entry and exit points. This allows them to take advantage of good market conditions and reduce potential losses. For example, a bullish chart may suggest a buying opportunity. Conversely, a bearish pattern may indicate it is time to sell. Stock charts also help investors monitor market volatility and momentum. These factors are crucial for understanding market behavior. During high volatility, traders may seek rapid price movements for short-term gains. Long-term investors, on the other hand, may focus on overall trends. Using stock charts improves investors' timing abilities. It helps them adapt their strategies as market conditions change. This can increase their chances of reaching their financial goals. By incorporating stock charts into their investment strategies, investors can enhance their market awareness. This leads to more informed decisions that align with their risk tolerance and investment objectives.
Reading Stock Charts
Investors can access many data points by looking at a chart. When interpreting these resources, it's important to consider trend lines, stock splits, and trading volumes.
Reading Trend Lines
Reading trend lines is a way to assess whether a price trend exists for a particular stock. Price trends are directional movements that consist of a set of higher highs and higher lows in a stock's price.
Trend lines can be drawn between those highs and lows, and they can provide technical analysts with a quick visual assessment of whether a trend exists and to what degree.
Many analysts also use trend indicators along with drawing trend lines, such as the 200-, 50- or 20-period MA.
Reading Stock Splits
Stock splits generally occur when a stock has risen significantly enough to make the stock price too high for average investors to buy in round lots of 100 shares. Thus, the stock split makes the stock available to more investors and generally fuels more demand, often causing the stock price to gain after the split.
For example, if a $100 stock splits 2 for 1, then the stock would open at $50 per share the next day — existing stockholders would then own twice the amount of stock they did before the split. A reverse stock split is the reverse of a stock split. For example, a stock trading at $1 per share has a reverse 10 to 1 stock split. For every ten shares owned, the stockholder would subsequently have one share at $10 per share.
Stock splits and reverse stock splits are generally adjusted on a stock's price chart on the day the split occurs. You do not have to consider splits when reading stock charts from professional charting services or trading platforms.
Reading Trade Volumes
The degree of interest that the market has in stock tends to appear in the stock's trading volume numbers. Notable shifts in trading volume can offer a helpful indication to support a directional movement in the stock.
Keep a keen eye on volume figures since changes in the stock's activity level can confirm breakouts from the classic continuation and reversal patterns technical analysts look for in a stock's price — they can have predictive value.
If a stock's price increases due to large volume, for example, it's probable that the stock will continue to rally and tend to confirm the upward move. The same concept tends to hold if a stock declines on a large amount of volume. When stocks fall, volume tends to increase incrementally as stops are hit, which can further fuel the decline and can even cause a crash.
Stock Chart Terminology
In addition to the price information on a stock chart, several other important fundamental stock data are often included in the graph. This information has considerable significance to stock traders and is referred to with specific terminology. Whether you came here to learn how to read Robinhood charts or uncover a few pointers, these terms are universal:
Ticker
The ticker shows the published flow of transactions in any given stock issue. The ticker was once recorded on a tape and the information printed on it was transmitted telegraphically across the country on a ticker system from 1870 until 1970. Today's ticker is electronic, but it has the same function of recording the time and sales price of every transaction in a stock, as well as the amount traded in most cases.
Dividend
The stock's dividend consists of the amount of money per share that a company pays out on the ex-dividend date to shareholders of record on a specific date. Shareholders need to have owned the stock on the date of record to receive the dividend typically 2 to 3 weeks later on the ex-dividend date. When a stock goes "ex-dividend," the stock's price is usually adjusted downward by subtracting the dividend amount from the initial opening price of the stock.
Yield
A stock's yield is the percentage of its price that is paid out as a dividend. For example, if a stock is priced at $100 per share and pays a quarterly dividend of $1 per share, then the annual yield on that stock would be $4, representing a dividend yield of 4% of the $100 share price.
High and Low
Stocks fluctuate during the trading session, reaching a high and a low price point in every trading session. The high and low prices can be very important to technical analysts and short-term traders who derive trading "pivot points" from these significant price levels.
P/E Ratio
The price-to-earnings (P/E) ratio is derived by dividing the price of the stock by the amount of money the company has earned over the year per share. Say a company's stock is trading at $25 per share and the company's yearly earnings are $3 per share. Then the P/E of that stock is $25/$3 = 8.3.
Open
The initial price of a stock on any given trading day. The opening price is determined by matching all limit and market buy and sell orders received before the trading session begins to arrive at a fair initial price.
Close
The last price a stock trades at when a trading session ends. The closing price is the one used to "mark to market" positions, so it determines the value of any positions held overnight.
Online Brokers With the Best Stock Charts
Top online stock brokers generally provide excellent charts to their clients. In addition, a number of non-broker websites like TradingView provide excellent stock charts free of charge. Benzinga has compiled a table of online brokers with the best stock charts below.
- Best For:Active and Global TradersVIEW PROS & CONS:Securely through Interactive Brokers’ website
- Best For:Global Broker for Short SellingVIEW PROS & CONS:securely through TradeZero's website


Stock Charts Are Invaluable to Technical Analysts
While some people may see the interpretation of stock charts by technical analysts to forecast the market's future direction as something like palm reading, the majority of market professionals depend on stock charts to get a clear picture of price action in the stock they're operating in. You start with, "I need to know how to read Robinhood charts," and you end with, "I want to see more information," because you better understand stock trading and how each chart affects your decisions.
Most would agree that the condensed information contained in a stock chart gives them an edge when making trading and investing decisions. So, if you're serious about operating in the stock market, it makes sense to learn how to read stock charts as the professionals do to give you a better chance of success.
Frequently Asked Questions
How do beginners read stock charts?
Beginners can read stock charts by recognizing basic components like price and time axes, as well as chart patterns. Familiarity with support and resistance levels helps identify buying or selling opportunities.
What are the best techniques to use in reading charts for beginners?
Some of the best techniques involve looking for support levels, resistance levels, trend lines and changes in the volume.
Which brokers have the best charts?
Webull, TD Ameritrade and Robinhood offer the best charts.
Related Content: FREE STOCK MARKET API TRIAL