Pattern recognition is one of the most beneficial traits humans have acquired through evolution. Processing information into patterns that enhance decision-making is why you can succeed in your ventures — from hunting and gathering to trading.
After traders started using charts as a visual representation of price movement, different price patterns caught the eye of market participants. Among them, flags have been one of the most reliable ones.
Read on to learn more about how to spot and trade bullish flags on the forex markets.
What is a Bullish Flag?
A bullish flag is a price action pattern. It falls into a category of continuation patterns, meaning that you trade in the direction of the trend.
Bullish flags consist of 2 parts: the pole and the flag. The initial burst of buying in almost vertical fashion creates the pole. Then, the following consolidation, caused by initial profit-taking, makes a range-bound price action that looks like the body of the flag — thus giving this pattern the name.
Bullish flags are great for beginners because of 3 factors:
- Easy to identify: Just like in the real world, flags tend to stick out in the environment — once you know what to search for.
- Reliable: Flags generally rank among the best chart patterns, with a success rate of over 66%.
- Precise entry and exit: Trading systems should always avoid ambiguity. Once you fine-tune your trendline drawing skills, flags provide accurate entry, stop-loss and take profit measures.
How to Identify a Bullish Flag
Like with patterns in any other environment, it takes some practice to train your eyes to spot patterns in the forex market.
Flags are easier to spot primarily because of the strong parabolic move that creates them; thus, the pole usually sticks out like a sore thumb.
You can observe the typical pattern on the chart below.

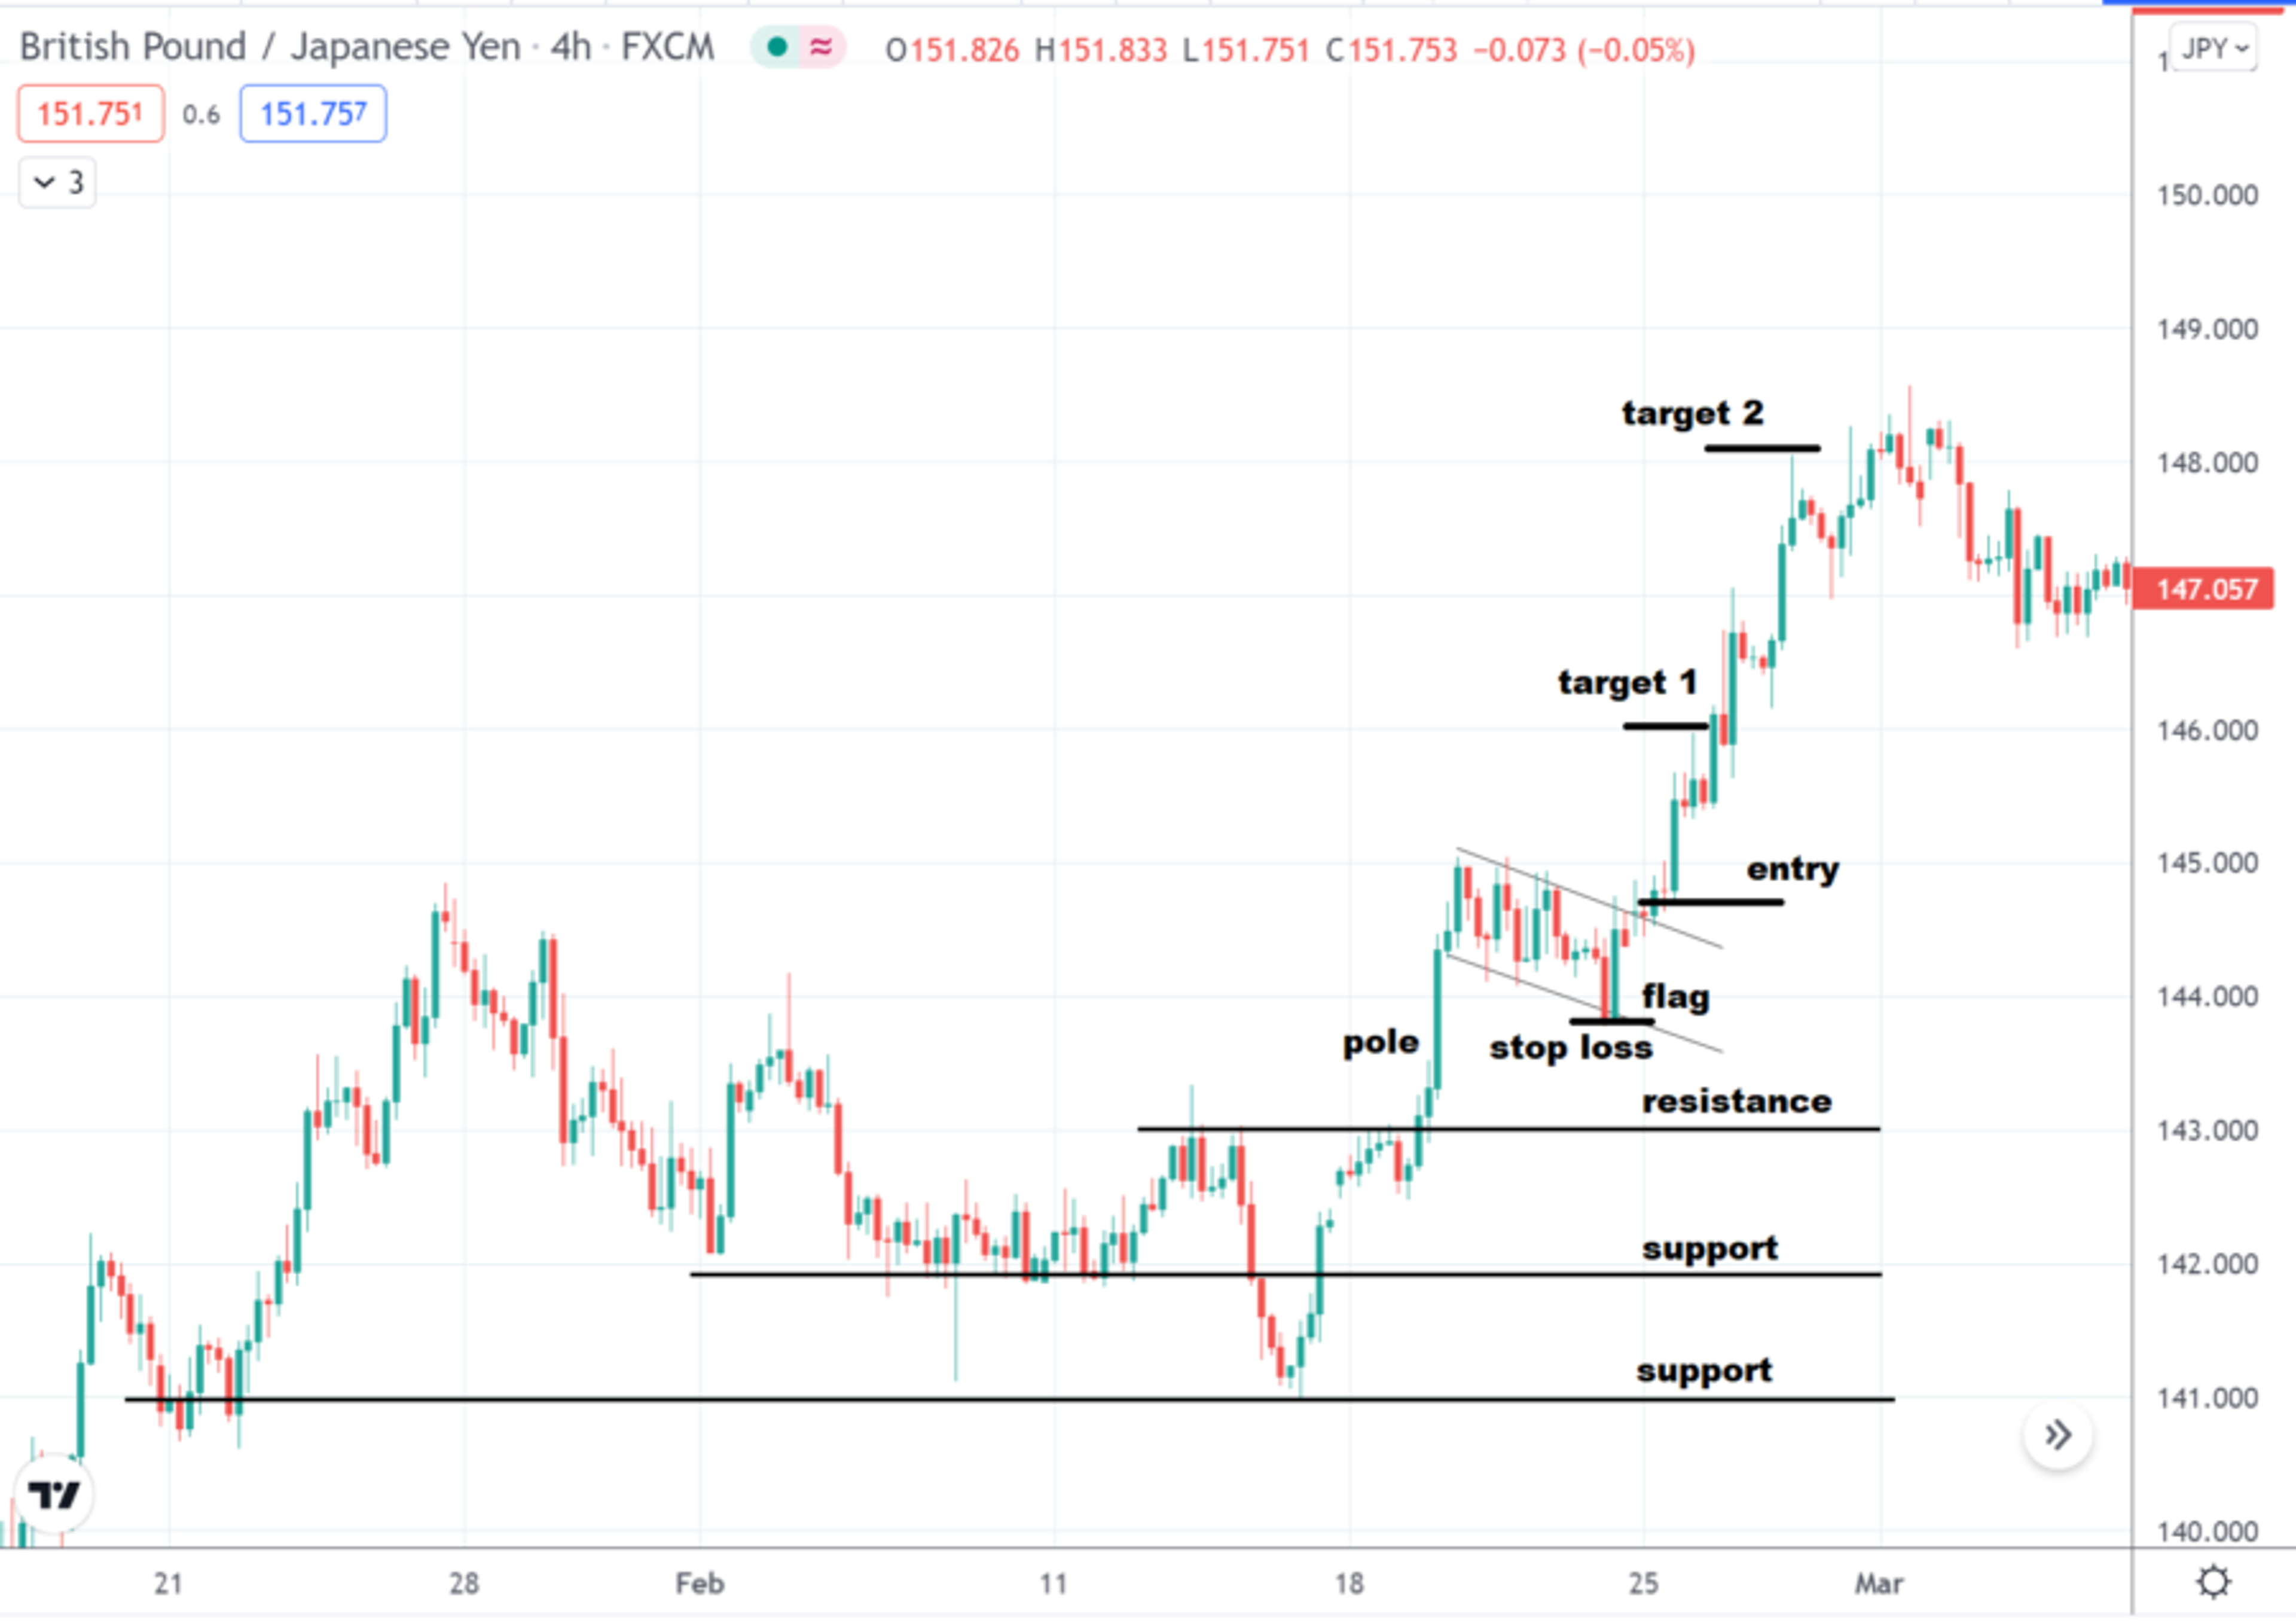
Bullish flag on a GBP/JPY 4-hour chart, Source: TradingView
In this example, you can observe several factors. The first is that despite pulling back to the support level at 142 and below, the price ultimately fails to create a lower low. This is an important clue for a bullish trend.
Then, it forces its way through resistance at 143, where savvy breakout traders jump on the opportunity and ride the trend toward the previous high. This is where the short-term profit-taking starts as intraday speculators start closing their positions.
This period of ranging creates the body of the flag. Finally, under the bullish pressure, the price closes above the upper trendline, signaling to pattern traders that the upward trend is ready to continue.
How to Trade a Bullish Flag
You can find bullish flags on all time frames. The good idea is to observe breakouts for potential setups if the price starts struggling after a parabolic move. In the example above, this is the resistance line at 143.
Once you identify the flagpole, you need to draw the flag trendlines. This requires a keen eye as these levels dictate the entry and stop-loss levels.
Once the upper trendline of the flag breaks and the price closes above it, that is your best entry point. The stop-loss will be below the candle wick of the lower trendline test.
In the example, this will be the small green candle that closes above the trendline after a lot of struggle to break through. Meanwhile, the stop-loss will be just below the lowest point that the price reached within the flag or approximately 85 pips from the entry.
Finally, you will calculate the take-profit level by projecting the length of the flag pole above your entry. For the example above, there are 2 possible options.
The 1st, conservative one is to use the flag length after the breakout. Suppose you measure from 143.00 until the flag formation at 144.300. This equals a take-profit of 130 pips. The 2nd one is more optimistic as it measures the pole from the lowest support at 141, thus giving it a projection target of 320 pips.
The 1st approach suits day traders as they can get in and out within a single session; the 2nd one is perfect for swing traders.
Risks of Trading the Bullish Flag
No chart pattern is perfect, and in the market anything can happen at any time.
Thomas Bulkowski, who studied a sample of 144 flags over 5 years, noted that the failure ratio was 12%. However, this analysis was for stocks; thus, it is likely skewed because stocks tend to rise over time while forex pairs trade as a ratio.
Another notable analysis includes one by Samurai Trading Academy that ranks the bullish flag pattern as one of the best price action patterns, with a success rate of 67.13%.
Thus, we can conclude that the bullish flag should work 2/3 times under the proper circumstances.
As always, you need to pay attention to the larger time frame to confirm the underlying bullish trend and observe the smaller details like pole length, flag formation, and avoiding fake breakouts.
In reality, it is many small details that contribute to avoiding costly mistakes.
What if You Find a Bearish Flag?
If you find a bearish flag, you might be in luck! Bearish flags are slightly more statistically successful.
Yet, before you immediately jump on the sell button, you need to double-check the most important thing — Is the currency pair actually in a downtrend?
Remember, flags are continuation patterns, meaning you are betting that the underlying trend will continue unwinding after a brief pause.
Regardless of the time frame you are using, always check the higher time frame to assess the trend. A chart-technical indicator that might particularly help in this task is the moving average.
Compare Forex Brokers
Every trader needs a reliable broker — a regulated intermediary between them and the market. We have compiled a list of our trusted brokers in the comparison table below.
- Best For:Earning Cashback on TradesVIEW PROS & CONS:securely through Forex.com's website
- Best For:Professional TradersVIEW PROS & CONS:Securely through Interactive Brokers’ website
- Best For:Funding BonusVIEW PROS & CONS:securely through tastyfx's website


Flags Favor the Patient
During the multidecade history of chart technical analysis, flags have been one of the favorite chart technical patterns. They are relatively straightforward to spot, reasonably reliable and provide both entry and exit guidelines.
Yet, they are not ideal. The accuracy of the pattern will primarily depend on your ability to draw proper trendlines.
Furthermore, flags can be time-consuming as they can unfold rather slowly and need a lot of babysitting. But, if you are willing to put in the time, resist the fear of missing out and wait for the pattern to unfold. You will add a valuable weapon to your trading arsenal.
Frequently Asked Questions
What is a bullish flag in forex?
A bullish flag is a chart technical continuation pattern formed in the consolidation between two significant rallies in the market.
As the market rallies, eventually, some market participants start taking profits and slow the momentum down. This pause in the momentum creates range bound movement that makes a visual representation of the flag. In contrast, the initial rally creates the visual representation of the pole on which the flag stands.
What does a flag mean in forex trading?
The flag is one of the popular chart patterns. These patterns that occur on the markets periodically provide for opportunities to trade with favorable risk-to-reward ratios. All of the popular patterns have a long track record with reasonably accurate statistical odds.
Patterns generally fall into 2 categories: reversal or continuation. Being a continuation pattern, a flag signals that the underlying trend will continue after a short period of consolidation.
Get a Forex Pro on Your Side
FOREX.com, registered with the Commodity Futures Trading Commission (CFTC), lets you trade a wide range of forex markets with low pricing and spreads, fast, quality execution on every trade.
You can also tap into:
- EUR/USD as low as 0.0 with fixed $7 commissions per $100k USD traded
- Powerful, purpose-built currency trading platforms like MT4, MT5, TradingView, cTrader and NinjaTrader
- Monthly cash rebates with FOREX.com’s Active Trader Program
Learn more about FOREX.com powerful trading platform and how you can get started today.

About Stjepan Kalinic
Forex, Equity Analysis, and Financial Education