Several technical analysis indicators are available for traders to use when entering and exiting markets, with each one having a variety of benefits. However, the MACD and RSI are two of the most widely used among both professional and retail traders. Therefore, learning and understanding them will help traders make more informed choices when it comes to analyzing, entering and exiting a position. If you are new to trading, they could even become a vital part of your trading strategy going forward.
- What is MACD?
- What is the VWAP
- What is RSI?
- See All 7 Items
What is MACD?
The MACD or Moving Average Convergence Divergence is an indicator used for trend following. It is a momentum indicator that shows the relationship between two moving averages, analyzing the difference between them.
The default settings are a 12-period exponential moving average (EMA), the fast length and the 26-period EMA, also known as the slow length. The 9-period EMA is the signal or MACD line, which is calculated by subtracting the 26 EMA from the 12 EMA.
The exponential moving average gives a more substantial weighting to recent price data as opposed to the simple moving average that calculates the average price over the period.
As mentioned above, there is a signal line on the chart, which does exactly as it says — provides trade entry signals. If the MACD moves above the signal line, it triggers a buy signal and if it crosses below the line, it triggers a sell signal. Here is an example:

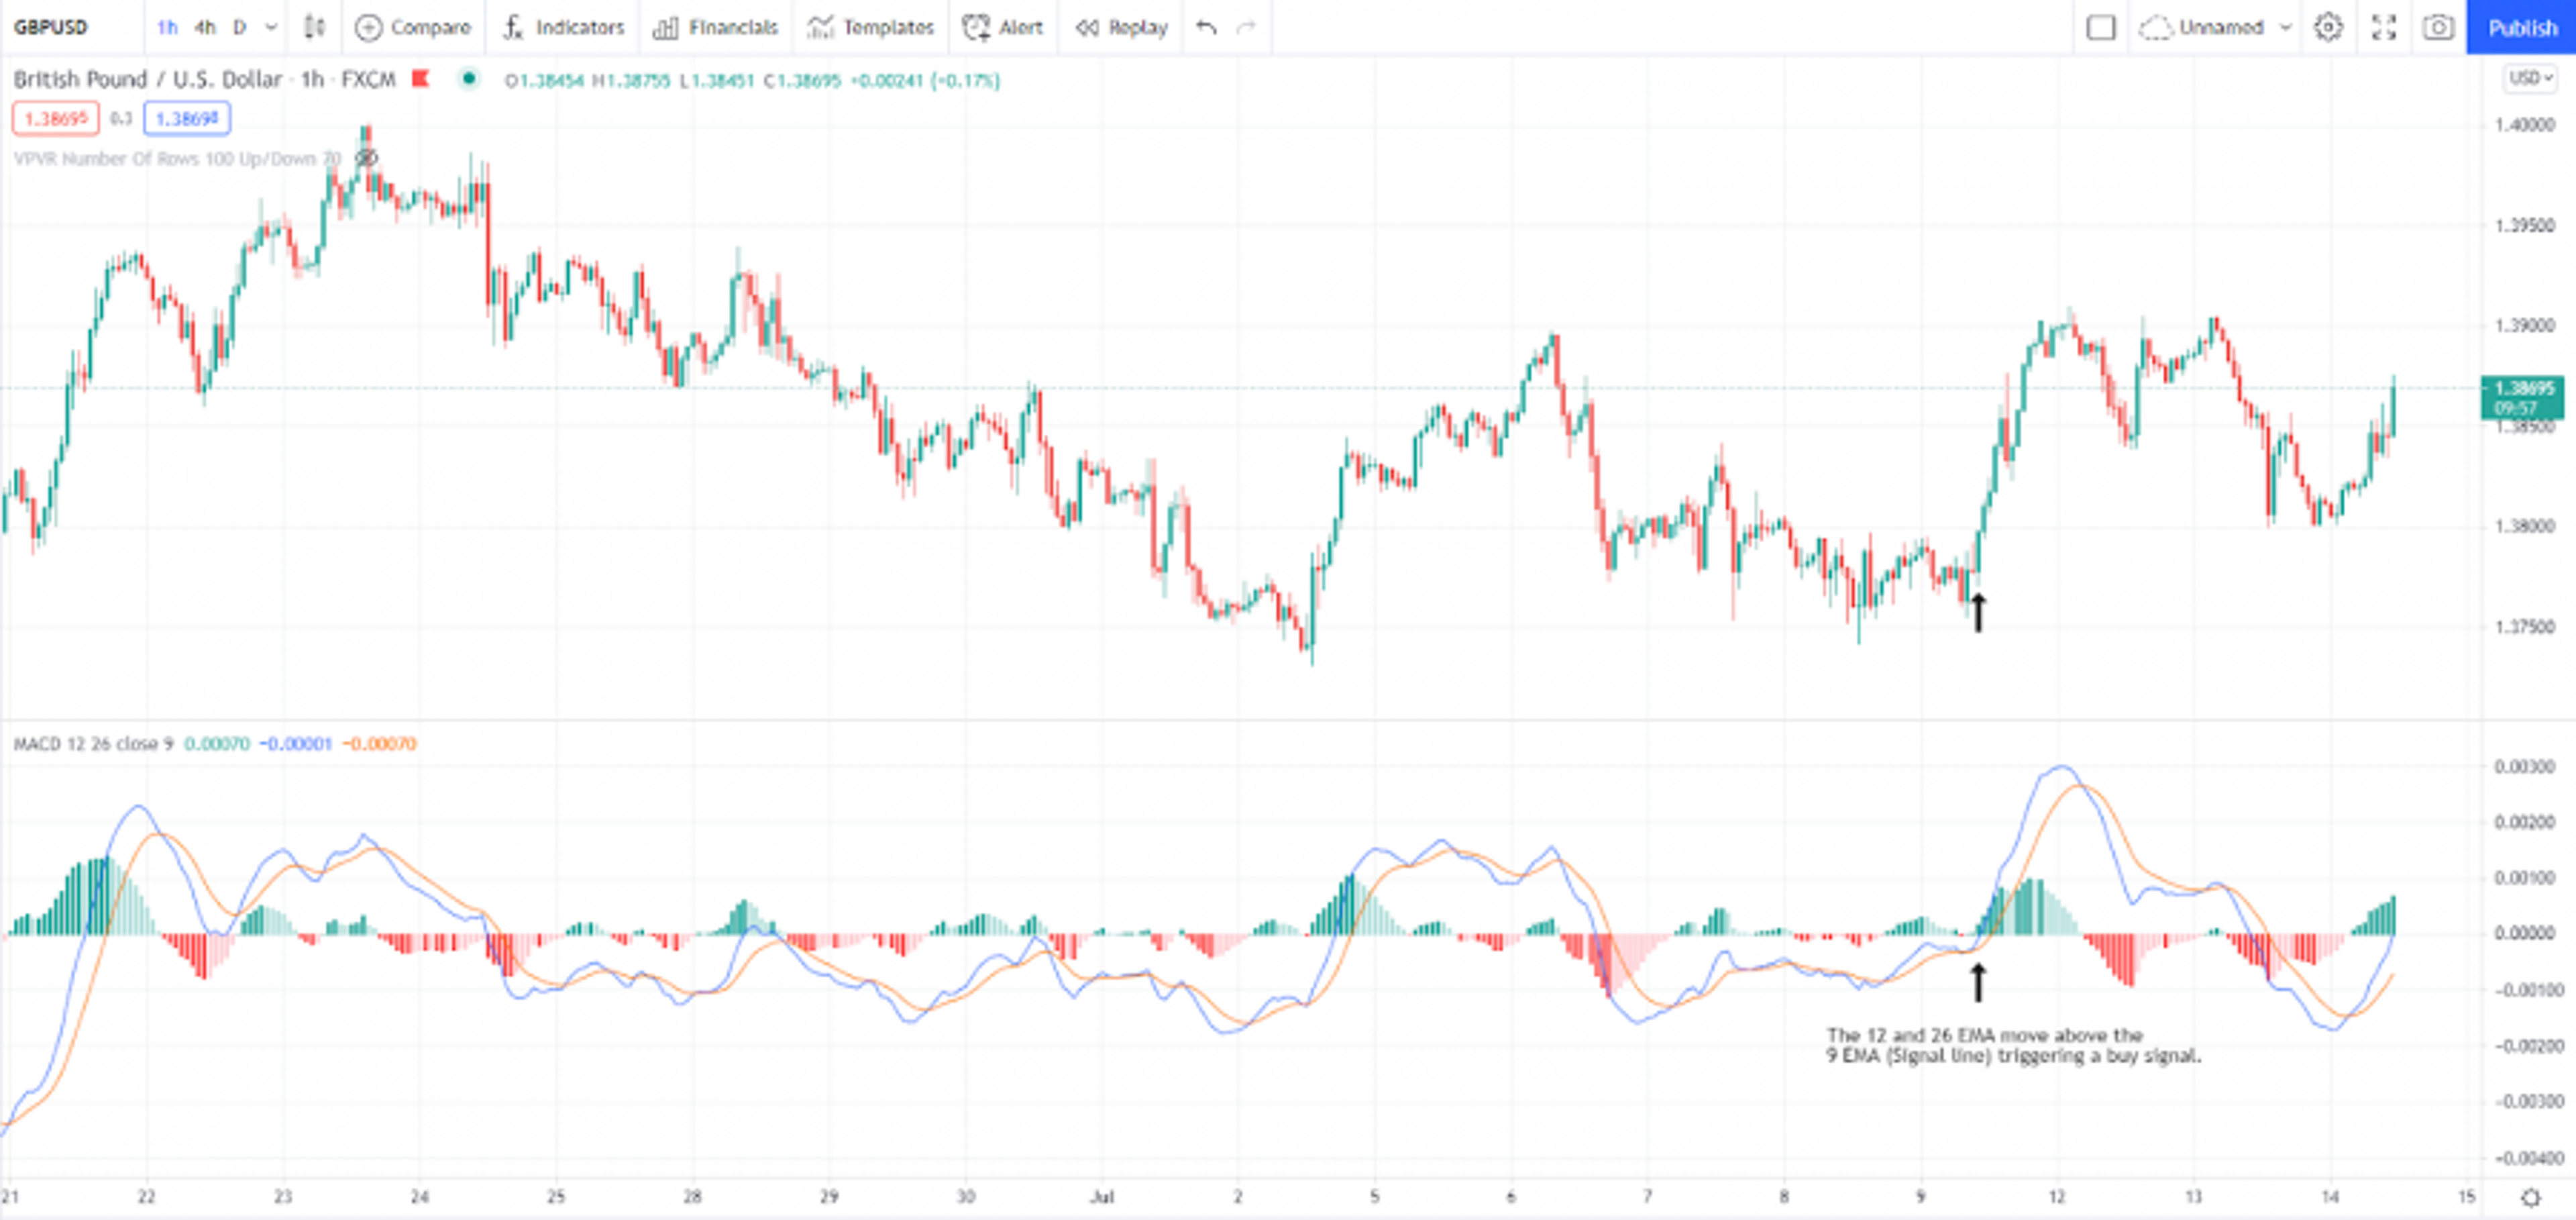
One hour candlestick chart of GBP/USD, Source: TradingView
The MACD moving above the signal line (9-period EMA) in the example above indicates that the market is experiencing bullish momentum, and the price is likely to continue higher. You will also notice that the faster moving average crosses above the slower moving average before crossing the signal line.
Alternatively, when the opposite occurs, and the price moves below the signal line, the slow length also crosses below the fast length, indicating that the momentum may continue lower, and now would be a good time to sell. Thus, the MACD crossover is a common strategy among traders.
From an analysis viewpoint, when you first open your chart, you will be able to look at the MACD and analyze if the current momentum is bullish or bearish and whether it seems as though the trend will continue or reverse.
What is the VWAP
The VWAP or volume-weighted average price is a price measurement tool that calculates the average price of a security based on volume and price over a specified period. It gives traders daily information about the asset’s price movement and value.
The VWAP, which is viewed as a single line on a chart, can be extremely useful, helping you define trends or enter and exit trades.
The VWAP can also be used in conjunction with other indicators such as the RSI or MACD. Using two of the three together can be used as confirmation of a trend or potential move.
Using the Moving Average in Other Ways
You can also customize the MACD settings to change the moving average periods to suit your trading style or strategy. For example, adjusting the periods so they are both lower will result in faster directional changes and more crossovers, while the opposite happens if you increase the periods of both EMAs.
Some traders use the MACD when already in a trade to confirm whether the current trend momentum will continue, therefore helping them decide when to close a position. If you have a long GBP/USD position and are unsure whether now is a good time to exit, take a look at the MACD and look at the current momentum.
You can also combine the two mentioned and use the MACD but increase the periods on the fast and slow lengths, so there are fewer crossovers which helps to navigate the volatility of the asset and help you to ride out longer-term trends.
What is RSI?
The RSI or Relative Strength Index is another momentum indicator that analyzes the strength and weaknesses of an asset’s trend to assess whether it is overbought or oversold. It computes the average price gains and losses over a specified period (the period setting).
As you can see in the chart further down this page, the RSI is shown as a line graph with two levels set at 70 and 30. Price can dip above and below these levels. The standard number of periods used on the RSI is 14, but this can be adjusted.
As you may have already guessed, if the line crosses above 70, it indicates that the asset is overbought, and if it falls below the 30 level on the RSI, it suggests that the security may be oversold.

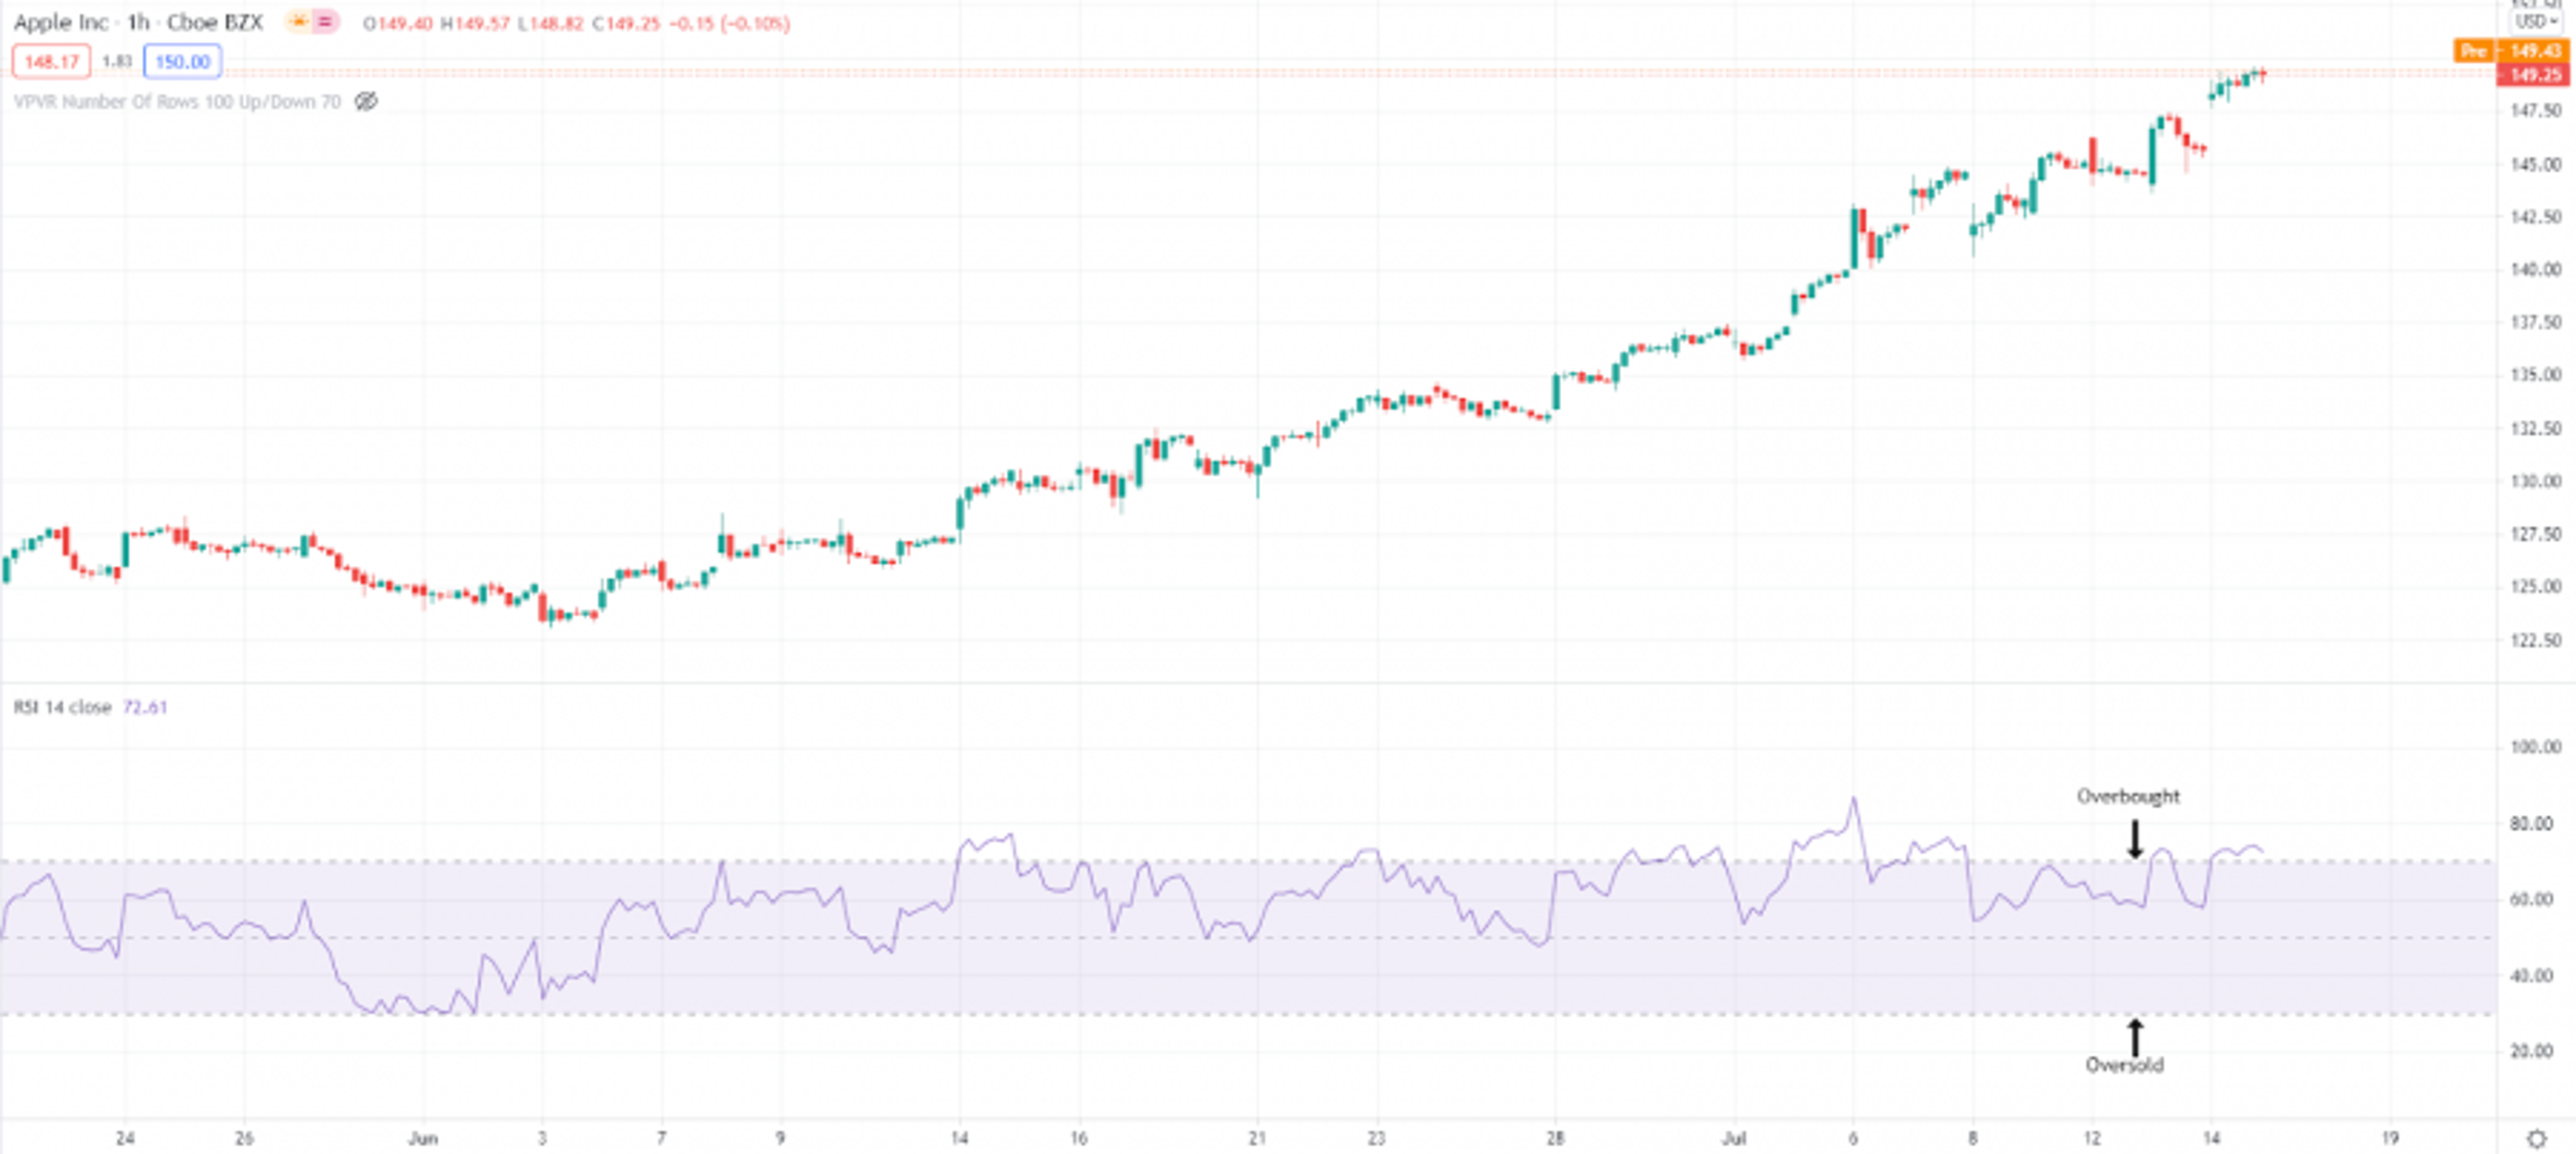
Apple Daily Chart, Source: TradingView
The chart above shows that the RSI for Apple’s current stock price is above 70, suggesting that at its current price, it may be overbought.
You can use the RSI to help you analyze a current trend or as a signal on when to enter or exit a position. However, as demonstrated above, the RSI can stay above 70 or below 30 for some time, so it is essential to understand how to use the indicator effectively.
While the standard settings for the overbought and oversold levels are 70% and 30%, these can also be adjusted. For example, traders may notice that a specific asset becomes overbought when it reaches 60% instead of the 70% level, so they can change them accordingly.
How Do the MACD and RSI Work Together?
Traders and analysts will often use the RSI and MACD together to give them a better understanding of the market. They are both momentum indicators, but they can provide a more complete view as they measure different aspects.
Used together, they can also provide confluence and confirmation of a changing trend. For example, if the MACD crosses above the signal line, suggesting bullish price momentum, and the RSI is below 30, suggesting it is oversold, this can be used to confirm a buy signal.
However, using them together can also mean they provide conflicting viewpoints. For example, if the MACD shows that an upward trend is increasing in momentum, but the RSI shows that the same asset is overbought, traders can find difficulty determining which indicator to put their faith in.
In truth, you should backtest and note down what happens to an asset’s price when the indicators both provide bullish and bearish signals so that it gives you confidence and assurance when entering a trade.
Benzinga’s Stock Research Platform
A streaming platform with all the information you need to invest smarter today.


Using The MACD and RSI In Your Trading Plan
Knowing how long to ride out a trend can be tricky for traders. But, as the saying goes, “the trend is your friend until the end.”
However, knowing when it ends is another question. That’s why using indicators such as the MACD or RSI can help to reduce the stress of deciding whether to hold or close a trade.
Knowing that many traders have the MACD and RSI as part of their strategies, is a good sign that they are effective, reliable and can be used effectively in a profitable trading plan.
Frequently Asked Questions
Is MACD a good indicator?
The MACD is one of the most popular indicators available. It provides leading and lagging indicators and is also easy to use, which is great for new and experienced traders alike. We even add it to our daily stock tips on Benzinga. It applies to daily, weekly and monthly forecasts.
What do RSI numbers mean?
The RSI measures price gains and losses over a specific period. The default period setting is 14. There is also an overbought level set at 70 and an oversold level set at 30. These numbers can be adjusted to suit a trader’s needs.

About Sam Boughedda, Stock Market Analyst
He is an expert in the following spaces: stock market news writing, analysis, and research.