Moving averages (MAs) are among the most basic technical indicators commonly used by forex traders in their currency trading strategies. Among the major benefits of their use in trading forex, MAs can provide you with clear trading signals and a good sense of the underlying trend in a currency pair’s exchange rate.
If you’re looking to find out how to use MAs in forex trading, then read on for more information on what MAs are and several popular forex trading strategies that use them.
What are Moving Averages?
MAs are technical indicators used by traders operating in virtually all financial markets. Depending on their reasons for using an MA indicator, forex traders can use several different types of MAs. They might also compute MAs for a range of time periods.
For forex traders, computing an MA involves taking some type of average of historical exchange rate observations made at the close of a particular time period (a week, day, hour or minute, for example) over a particular lookback duration (10 weeks, 10 days, 10 hours, 10 minutes, for example).
As a new time period closes, the MA is then moved forward to include that new observation, while the most distant observation is dropped from the average to maintain a consistent lookback duration. The MA is then plotted over the price action as it evolved over time so that it can be compared with the price action and with other shorter or longer-term MAs.
Traders can select MAs of different durations, depending on their focus. For example, longer-term currency trend traders might look at the slowly-moving 50, 100 and 200-day MAs of a currency pair’s exchange rate to get a sense of the medium- and long-term trends for the pair. In contrast, shorter-term traders like scalpers and day traders might look at much more reactive MAs computed for smaller durations like 10 minutes and 60 minutes.
Common MA types used by forex traders include simple or arithmetic moving averages (SMAs), weighted moving averages (WMAs), smoothed moving averages (SMMAs) and exponential moving averages (EMAs).
Less well-known types of MAs include adaptive and fractal adaptive MAs, double and triple exponential MAs, variable index dynamic averages and triangular and variable MAs.
Computing each of these MA types involves a different calculation method. Fortunately, most of the MA types you will want to use are already offered by forex trading platforms that provide extensive technical analysis features, such as the MetaTrader 4 and 5 platforms developed by MetaQuotes that you can download for free.
If your chosen trading platform does not offer a particular MA that you wish to use, then you may have to calculate it yourself using spreadsheet software or code it into your trading platform if that option exists.
4 Moving Averages Trading Strategies
These strategies work in a variety of timeframes, so they could suit forex day traders and longer-term strategic traders.
Moving Average Convergence Divergence Strategy
The MACD indicator is a momentum indicator that shows the difference between a 12-period and a 26-period EMA in histogram format. In addition, a 9-period EMA of the MACD histogram is plotted over it as a signal line that is usually drawn in red. As you can see in the image below, the MACD is generally shown in an indicator box below the exchange rate chart for a currency pair.
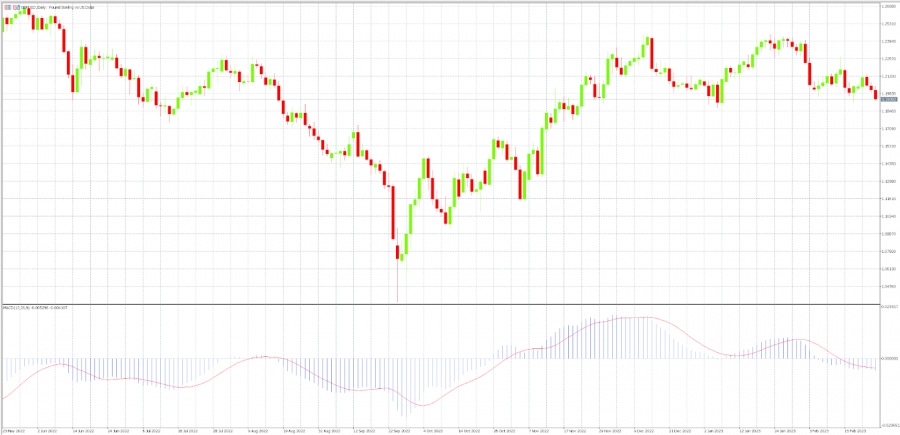
The 12,26,9 day MACD indicator is plotted in an indicator box beneath the daily exchange rate chart for GBP/USD. The MACD histogram appears in blue, while the signal line is shown in red. Source: MetaTrader 5.
The MACD histogram also lies above or below a central zero line, a fact that is used to indicate the present direction of the underlying market trend. Specifically, a MACD reading above the zero line suggests an upward trend exists, while a negative MACD reading indicates a downward trend is in progress.
Forex traders have devised a variety of strategies that use the MACD. An especially popular one involves trading when the red signal line crosses over the MACD histogram. This indication would generate either buy or sell signals as follows:
- Rising Market: In an uptrend signaled by the MACD being above zero, a buy signal is generated when the MACD histogram rises above the red signal line. Stops could be placed below the most recent market low level, and you could close out the position if the MACD falls below zero.
- Falling Market: In a downtrend when the MACD histogram lies in negative territory, a sell signal is generated when the MACD falls below the red signal line. Stops could be placed above the level of the most recent market high, and this position could be closed when the MACD rises above its signal line.
Ribbon Trading Strategy
A moving average ribbon consists of a series of MAs plotted on an exchange rate chart. As shown in the image below, the MAs typically have durations ranging from very short-term to long-term.
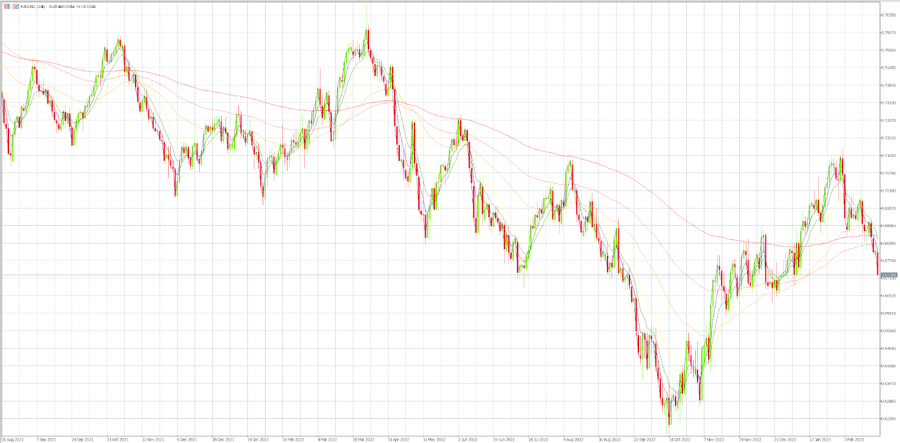
Daily candlestick chart for AUD/USD showing an EMA ribbon consisting of 1, 5, 10, 20, 50, 100 and 200-day EMAs superimposed over the exchange rate. Source: MetaTrader 5.
The MA ribbon provides an indication of a trend’s direction and strength. If the MAs that compose the ribbon are all rising or falling, then that indicates an up- or downtrend, respectively. When the ribbon of MAs widens or fans out, that suggests a strong trend exists.
MA crossovers within the ribbon can also provide trading signals as with a pair of MAs. Traders just need to choose how many crossovers to use to generate an actionable trading signal from the MA ribbon.
Another MA ribbon strategy can be used to signal a notable market breakout higher or lower after an extended period of range trading during which all or most of the ribbon’s MAs have converged closely and the exchange rate has flattened out.
First, look for a time when the ribbon’s MAs have mostly formed a thick line with little deviation. Then bracket the range by placing a buy order above the high point of the range and a sell order below the low point of the range.
If the market subsequently breaks to the upside to trigger the buy order first, the sell order you have already entered below the range’s low point will serve as your stop loss. Alternatively, if the market falls to trigger the sell order first on a downside breakout, then the outstanding buy order above the high point of the range will serve as your buy stop.
You can take profits at a point determined by projecting the width of the trading range in the direction of the breakout.
Envelopes Trading Strategy
Moving average envelopes are made by computing and displaying lines with a set percentage or standard deviation above and below a moving average of any type that forms a band around the MA. Much like Bollinger Bands, these MA envelopes can help forex traders visually identify an overbought and oversold market within an overall directional trend.
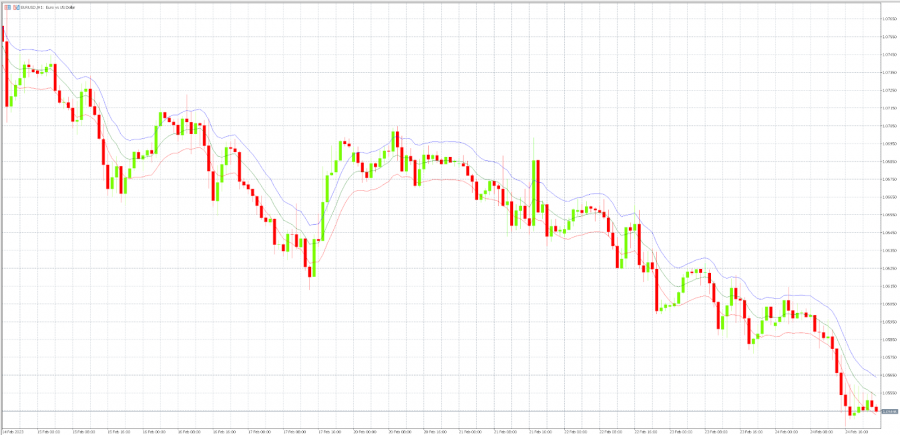
Hourly candlestick chart of EUR/USD showing a 10-hour EMA in green with blue and red envelope lines set 0.1 standard deviations (6.8%) respectively above and below the EMA. Source: MetaTrader 5.
Traders can experiment with using different envelope percentages and MA time periods to see what works best to generate trading signals for a particular currency pair. Keep in mind that envelope percentages may need to increase when volatility rises or decrease when volatility falls.
A possible envelope trading strategy could involve first looking for a currency pair showing a strong directional trend to trade along with. Then proceed as follows:
- Rising Market: If the market is generally rising as shown by an upward slope to the MA’s line, then you could aim to buy when the market reaches the MA line and starts to rise from that point with the plan of exiting the trade near the upper envelope line. A sell-stop order could be placed below the most recent market low.
- Falling Market: If the market is instead falling overall as shown by a declining MA line, you could sell when the market gets to the MA line and continues falling with the goal of taking profits near the lower envelope line. A buy-stop order could be placed above the most recent market high.
Guppy Multiple Moving Average Strategy
The Guppy Multiple Moving Average (GMMA) strategy was invented by Australian Daryl Guppy and consists of two distinct sets of EMAs plotted over the exchange rate on a chart. As shown in the image below, the first EMA set shown in blue consists of short-term EMAs with 3, 5, 8, 10, 12 and 15-day durations. The second EMA set shown in red consists of long-term EMAs with 30, 35, 40, 45, 50 and 60-day durations.
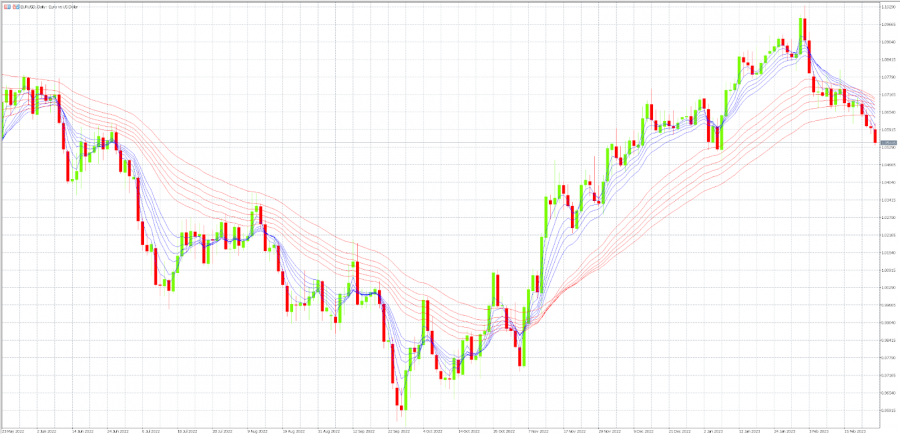
The two GMMA EMA sets are plotted in blue (short-term) and red (long-term) over a daily candlestick chart for EUR/USD. Source: MetaTrader 5.
Like with the MA Ribbon trading strategy, traders typically look for crossovers between the short- and long-term EMA sets that suggest the trend could be shifting. If a particular currency pair needs to have its parameters adjusted, the longer-term EMAs are generally changed while the short-term EMAs are left alone.
Simple Moving Average (SMA) vs. Exponential Moving Average (EMA)
The two most common MAs used by forex traders are the simple moving average (SMA) and the exponential moving average (EMA).
The main difference between the two types of MAs is that the SMA is computed by taking the arithmetic mean or average exchange rate over a set number of time periods, while the EMA puts more weight on recent exchange rate observations than on older observations.
If you need an easy-to-calculate trend indicator to reflect the prevailing trend over a historical time frame, then the SMA should suffice. On the other hand, if you want to generate trading signals that have better predictive power in the short term, then an EMA tends to show better results because it weighs the most recent exchange rate data more heavily in its calculation.
Is Moving Average Trading Profitable?
MAs help technical currency traders smooth out historical exchange rate movements so that they can identify the direction of the underlying trend. Since trading along with trends is one of the foundational principles of profitable trading wisdom, MAs offer a great trend identification tool to forex traders interested in making money from trending currency markets.
Traders can use MAs on their own to generate trading signals, as well as in envelope and ribbon trading strategies. MAs can also be used to compute another technical indicator called the Moving Average Convergence Divergence (MACD) indicator that provides clear and reliable trading signals.
Keep in mind that since MAs are a lagging indicator, experienced forex traders typically use them in combination with other technical indicators that have greater predictive power about future exchange rate moves. MAs also tend to show the best profitability results when used to analyze highly trending markets since choppy and ranging markets can result in whipsaws that can eat into your trading profits.
Should You Use Moving Averages when Trading Forex?
Those forex traders who want to get a sense of the direction of the underlying trend for a currency pair will generally find one or more types of MAs helpful in their market analysis. MAs help smooth out exchange rate movements so that underlying directional patterns can emerge for the astute analyst to profit from.
On the other hand, purely fundamental forex traders or those who trade the news and other current events might not find MAs as useful. Also, keep in mind that MAs tell you information about historical exchange rate levels rather than about future exchange rates, so they are primarily a lagging indicator without significant predictive value.
With that noted, MAs can be used in combination with other leading indicators to provide objective and potentially profitable trading signals. The MACD oscillator, which is based on MAs, has an excellent track record as an indicator of market momentum that can be useful to swing traders.
Frequently Asked Questions
What is the 21-day MA in forex?
The 21-day MA is computed over a Fibonacci number of days and has been used by some technical forex traders, especially those who follow Elliott Wave Theory, to assess the direction of the medium-term trend for a currency pair, since a 21-day period roughly corresponds to the number of forex trading days in a month.
What is the best MA to use in forex?
While many technical forex traders routinely use the 10, 20, 50, 100 and 200-day moving averages in their analysis, the best MA to use as a forex trader will depend on what timeframe your analysis is intended to cover and be relevant to.
Are MAs effective?
MAs are an effective way for forex traders to assess the direction and strength of the prevailing trend. They tend to be best used in combination with other technical indicators in trading strategies.