When it comes to trading shifting exchange rates in the forex market, mastering forex technical analysis and the various indicators used in it can be the key to unlocking profitable trading strategies.
Among the tools used by technical analysts, the relative strength index (RSI) remains a powerful momentum oscillator that provides traders with valuable insights into forex market trends and momentum. The RSI’s true worth lies in its divergence versus the exchange rate, which gives traders actionable signals they can incorporate into their trading plans.
In this comprehensive RSI Divergence Cheat Sheet, Benzinga explores the intricacies of this commonly used indicator to equip you with the knowledge needed to use it to improve your forex trading decisions and success rate.
What is RSI Divergence?
Before exploring what RSI divergence itself means, it is generally helpful to gain an understanding of the concept of divergence in general. Divergence occurs when an oscillator, such as the RSI, diverges from the exchange rate or price action of the underlying asset.
This discrepancy in movement between the highs or lows seen in the oscillator and on the exchange rate chart above it offers forex traders a powerful signal because it hints at potential shifts in market momentum that can reverse short- and long-term exchange rate trends.
In particular, RSI divergence refers to the situation where the RSI indicator and the exchange rate movement display contrasting patterns. It comes in two primary forms: regular and hidden divergence, each of which can be either bullish or bearish.
The regular versions of these four RSI divergence variations act as a compelling indication of potential trend reversals, while the hidden versions offer a trend continuation signal to observant traders. All of them can provide you with valuable insights into forex market dynamics that you can incorporate into your trading plan.
How the RSI Divergence Signal Works
The RSI is perhaps the most widely used momentum oscillator. It measures the speed and change of exchange rate movements. The indicator is bounded and oscillates between levels of 0 and 100.
RSI values above 70 indicate overbought conditions, while RSI values below 30 suggest oversold market conditions. When the RSI diverges from the exchange rate movement, it signifies a potential shift in forex market sentiment because the indicator’s behavior contradicts the market’s action. Regular divergences seen when the RSI lies in overbought or oversold territory generate reasonably reliable trading signals that suggest a market reversal is more likely than not.
To understand the mechanism behind RSI divergence properly, you may want to study the concept of market momentum first. When the exchange rate forms higher highs, the RSI should ideally mirror this behavior with higher peaks in order for it to confirm the rising trend. Conversely, when the exchange rate forms lower lows, the RSI should follow suit to confirm the declining exchange rate movement.
Regular divergence occurs when the RSI fails to confirm these market movements by making a lower high in an uptrend or a higher low in a downtrend. When this happens in extreme RSI territory with readings above 70 or below 30, this signals a moment when the directional move is losing momentum so a possible trend reversal could occur.
Types of RSI Divergence and What They Mean
Having established a solid understanding of RSI divergence and its significance in providing valuable insights into potential trend reversals and continuations, you can now focus on exploring the four types of RSI divergence shown in the image below.
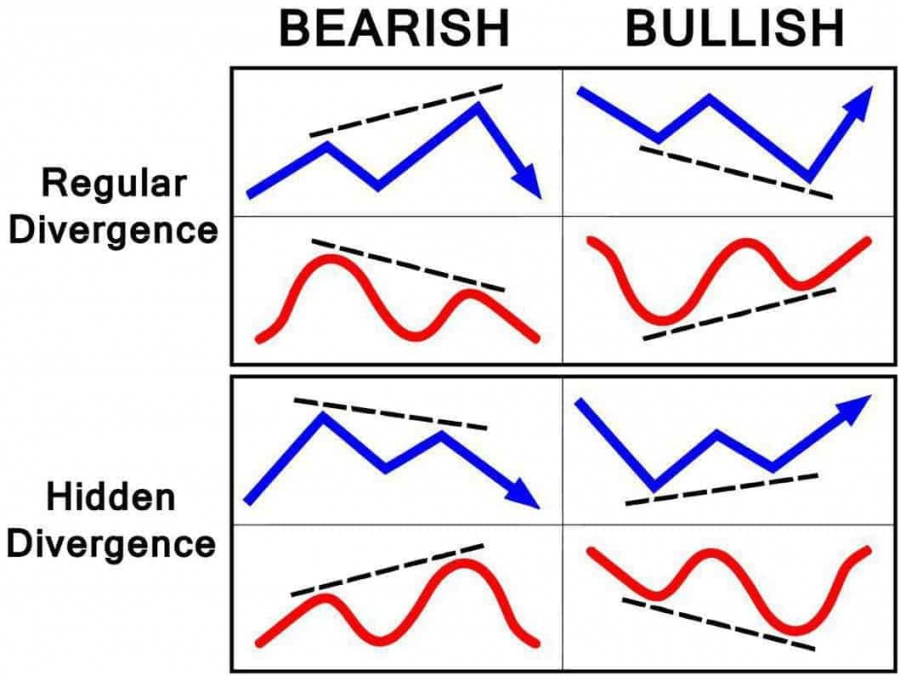
Schematic diagrams of regular and hidden exchange rate/RSI divergence. Source: CryptoPotato.
These are bullish and bearish regular divergence that signal market reversals and bullish and bearish hidden divergence that signal a continuation of the prevailing trend. Each variation of RSI divergence manifests as a unique juxtaposition between the overall market action and the RSI indicator that sheds light on the underlying dynamics of the sentiment of forex market participants.
As you explore the specifics of these four RSI divergence types in the subsections below, you will uncover the intricate behavior of the exchange rate versus the RSI indicator. This behavior makes the divergences seen between them powerful trading strategy indicators that offer traders greater precision and possible success when operating in the forex market.
Bullish Regular RSI Divergence
Bullish divergence occurs when the exchange rate forms a series of lower lows to indicate a downtrend exists, while the RSI forms higher lows in opposition to the prevailing declining exchange rate trend. The psychology behind this divergence phenomenon suggests that the selling pressure that has been driving the downtrend is weakening, which sets up the possibility of a bullish reversal on the horizon. The higher lows on the RSI imply a hidden strength in the market as downside momentum wanes and potential buyers stand ready to step in. Ultimately, this type of RSI divergence should lead to a potential bullish trend reversal to the upside, especially if it occurs when the RSI reads in oversold territory below the 30 level.
Bearish Regular RSI Divergence
As the mirror image of bullish RSI divergence, bearish RSI divergence manifests when the exchange rate forms a set of higher highs to signal an uptrend is in progress, but the RSI forms a series of lower highs that diverge from the prevailing market direction. This RSI divergence signal gains strength when it occurs in overbought territory above the 70 level.
Such a scenario suggests that the buying pressure is dwindling as the rally loses momentum, so a bearish reversal may be forthcoming. The lower highs on the RSI indicate a hidden weakness exsits in the market, as potential sellers remain ready to take control. Eventually, this situation can lead to a bearish trend reversal to the downside.
Bullish Hidden RSI Divergence
Bullish hidden RSI divergence is a more subtle form of divergence that carries significant implications for a continuation of the prevailing trend. This particular type of divergence arises during an uptrend when the exchange rate forms a series of higher lows that could indicate subtle market strength while the RSI contrastingly exhibits a set of lower lows. This market strength seemingly contradicts the weakening trend seen in the RSI, and the discrepancy implies that the market’s upward momentum remains intact. Hidden bullish divergence suggests that the underlying uptrend is likely to persist and gain further momentum in the near future.
Traders can capitalize on this hidden strength by considering keeping or taking long positions during any pullbacks with the goal of riding the continuation of the uptrend as the exchange rate’s rally resumes in earnest. Like with any trading strategy, it is helpful to validate such signals with supporting indicators or confirming market action before executing trades solely based on hidden bullish divergence.
Bearish Hidden RSI Divergence
Bearish hidden RSI divergence presents a mirror image of its bullish counterpart and has relevance for forex traders seeking opportunities in a downtrend. It emerges during a downtrend when the exchange rate forms a series of lower highs, suggesting decent downward momentum. For its part, the RSI exhibits a set of higher highs that seemingly deviate from the exchange rate moves. This bearish RSI divergence type signifies that strong selling pressure still prevails, so traders should aim to sell on any market rally.
The presence of hidden bearish divergence implies that the prevailing downtrend is likely to persist and will continue to gather strength in the near future. This provides a trading opportunity to establish short positions during exchange rate bounces while you anticipate an eventual continuation of the downtrend. Traders observing bearish hidden RSI divergence should exercise caution and use additional confirmation tools to validate its trading signals.
Practical Application and Trading Strategies
RSI divergence can be a practical and transformative addition to any forex trader’s toolkit. By identifying clear RSI divergence signals, timing trade entry and exit points wisely, confirming divergence signals with market action and incorporating multiple time frame analysis methods, currency traders can more safely capitalize on the power of this remarkable momentum indicator to generate profits. The following sections explore in greater detail the practical aspects of optimizing the use of RSI divergence in various forex trading strategies.
Identify Clear RSI Divergence Signals
To effectively trade RSI divergence, the first step is to identify clear and distinct divergence signals. Look for instances where the RSI and exchange rate movements display noticeable diverging patterns. For example, bullish regular divergence presents itself when the exchange rate forms lower lows while the RSI exhibits higher lows. In contrast, bearish regular divergence occurs when the exchange rate forms higher highs, while the RSI shows lower highs. Avoid relying on minor market fluctuations or ambiguous chart patterns that may lead to false signals.
Time Your Trade Entry and Exit Points Well
Timing is important when trading forex, and RSI divergence can offer valuable cues for entering and exiting trading positions. When you spot clear bullish regular divergence in a currency pair that has been declining, consider entering a long position because you can now reasonably anticipate a potential trend reversal to the upside. If you instead observe bearish regular divergence, consider establishing short positions since an impending trend reversal to the downside seems likely. Remember to exercise caution and use additional supporting indicators to validate your trade entry and exit points.
Confirm Signals with Market Action
While RSI divergence can provide insightful trading signals, confirming its predictions by observing market movements is a prudent approach to using them in practice. Seek confirmation of RSI divergence signals by other technical indicators, such as trendlines, support and resistance levels or candlestick patterns. A confirming candlestick formation following the appearance of RSI divergence can boost your confidence in the trade and reduce the risk of operating on false signals.
Look for Divergence Across Multiple Time Frames
Incorporating analyses of multiple time frames can add depth and conviction to your RSI divergence trades. Assessing divergence signals across different time frames can provide a comprehensive view of market trends and reinforce the accuracy of your RSI divergence trading decisions. For instance, if you spot bullish RSI divergence on both daily and hourly charts, then it strengthens the potential of a trend reversal to the upside and offers a higher probability trade setup.
Use Hidden RSI Divergence for Trend Continuation
Beyond trend reversal signals, hidden RSI divergence can also offer valuable insights for trend continuation trades because this more subtle form of RSI divergence provides an early signal of a potential trend continuation. Traders can use hidden RSI divergence to strengthen their trend-following strategies because it often occurs within a strong prevailing trend.
As detailed above, bullish hidden divergence occurs when the exchange rate forms higher lows while the RSI displays lower lows, while bearish hidden divergence involves lower highs in the exchange rate along with higher highs in the RSI. This more subtle form of RSI divergence suggests that the underlying trend is likely to continue. Incorporating hidden RSI divergence signals into your trading strategy can be an especially powerful tool for trend-following forex traders.
Practice Prudent Risk and Money Management
Implementing proper risk and money management practices is a key element of success when trading RSI divergence. Make sure to define your risk tolerance, set appropriate stop-loss levels, use trailing stops and avoid risking an excessive portion of your trading capital on a single trade. While RSI divergence can provide valuable trading signals, potential losses in case the signal fails should always be managed to make them tolerable.
Test and Adapt Your Strategy
Your RSI divergence trading strategy may need to change to reflect shifts in forex market conditions over time. Remember to test and analyze the performance of your RSI divergence-based trading strategy to identify any strengths or weaknesses. Learn from past trades, adapt your approach as needed and fine-tune your strategy based on the outcomes it produces. Develop a strategic trading mindset and seek to refine your RSI divergence trading skills as your experience develops.
Overall, whether it be for spotting potential trend reversals or trend continuation points, RSI divergence serves as one of the more reliable indicators you can use as a guide when navigating the complexities of trading the forex market. Still, traders should approach this tool with prudence, practice sound risk and money management practices and aim to adapt and refine their RSI divergence trading strategies to harness its full potential more effectively.
Advanced Techniques for RSI Divergence Analysis
Beyond assessing the basic forms of bullish and bearish divergence, various sophisticated techniques for performing and using RSI divergence analysis can enhance the precision of your technical analysis-based trading methodology and further enrich your forex trading strategies. Such advanced trading methods can include:
Multiple Time Frame Analysis
Using multiple time frame analyses along with RSI divergence can provide forex traders with a comprehensive view of currency market trends and significantly strengthen the accuracy of their trading decisions. By analyzing RSI divergence signals across various time frames, traders gain a broader perspective of the prevailing forex market dynamics.
For example, identifying a bullish RSI divergence on a higher time frame like the daily chart for a currency pair helps confirm the potential for a significant trend reversal to the upside, especially if you simultaneously observe a bullish RSI divergence on a lower time frame chart like the four-hour or one-hour. You can also pinpoint optimal entry points with tighter stop-loss levels and better risk-reward ratios by doing this multiple time frame analysis.
By aligning RSI divergence signals across multiple time frames, traders also can confirm the validity of potential trend reversals or continuations and make more informed and precise trading decisions, while minimizing the impact of false signals. This more comprehensive approach to RSI divergence analysis tends to give traders greater confidence in their RSI divergence strategy.
Combining RSI divergence analysis across different time frames in a trading strategy can strengthen the validity of the signals produced by the momentum indicator. Also, confirming that divergences exist across longer and shorter time frames tends to increase the probability of making an accurate trade decision based on RSI divergence.
Combining RSI Divergence with Other Technical Indicators
RSI divergence can be even more powerful when used in conjunction with other technical indicators. The convergence of multiple indicators with the same implications can provide a comprehensive confirmation of potential trend reversals signaled by RSI divergence. Also, combining RSI divergence with other technical indicators can essentially yield a more robust and well-rounded trading approach.
Technical analysis offers a diverse array of tools that can complement the signals generated by RSI divergence to enhance the accuracy and reliability of your trading decisions. For instance, pairing RSI divergence with moving averages, Bollinger bands, trendlines, classic chart patterns, Fibonacci retracement levels and support and resistance levels can provide valuable confirmation of potential trend reversals or continuations.
In addition, incorporating candlestick patterns or chart formations can offer further validation of RSI divergence signals, while using oscillators such as the moving average convergence divergence (MACD) or the Stochastic Oscillator alongside RSI divergence can create confirmation among multiple indicators to reinforce the strength of the trading signal they generate.
By combining RSI divergence with a carefully selected set of complementary technical indicators, forex traders can develop a comprehensive and well-informed trading strategy that capitalizes on market opportunities with increased precision and confidence. Remember to strike a balance and avoid overloading your analysis with too many indicators because simplicity and clarity remain key aspects of successful forex trading to avoid analysis paralysis.
Should Forex Traders Use the RSI in Their Trading Strategies?
Both regular and hidden RSI divergence are valuable tools that can benefit various types of forex traders. Swing traders can use regular RSI divergence to identify potential market reversals or swings, while hidden RSI divergence tends to signal a forthcoming trend continuation that can be of assistance to trend followers.
Day traders can also use RSI divergence techniques on shorter time frames to profit from trading opportunities that arise on an intraday basis in the forex market. Trend traders seeking to hold positions over more extended time periods as they follow prolonged directional movements can use hidden RSI divergence as a confirmation signal to support their strategy by suggesting that a trend continuation seems likely.
Incorporating RSI divergence into your forex trading repertoire can significantly enhance your ability to make better trade choices. Understanding how to practically apply this powerful momentum indicator and implement effective trading strategies can be the key to unlocking its full potential.
Frequently Asked Questions
Does RSI divergence really work?
Yes, RSI divergence can be an effective technical analysis trading tool to assess waning market momentum, so it can serve as a valuable signal of a potential market reversal. The indicator is especially helpful to traders when used along with other indicators and chart patterns to provide confirmation signals.
What is the best setting for RSI divergence?
The ideal RSI setting for divergence analysis can vary depending on the trader’s trading style and the specific financial instrument being analyzed. Commonly used time periods for the RSI calculation include 14 or nine periods, but traders can experiment with different settings during their back-testing process to find out what number of periods works best for them and the specific market they are trading.
What time frame is best for RSI divergence?
RSI divergence can appear on charts of any time period, so the choice of the best time frame for RSI divergence analysis depends on the trader’s trading horizon. Short-term traders may use lower time frames for their RSI divergence analysis, like the five-minute or 15-minute charts, while longer-term traders may focus on watching the RSI under daily or weekly charts to gain a broader perspective on forex market trends.
Get a Forex Pro on Your Side
FOREX.com, registered with the Commodity Futures Trading Commission (CFTC), lets you trade a wide range of forex markets with low pricing and spreads, fast, quality execution on every trade.
You can also tap into:
- EUR/USD as low as 0.0 with fixed $7 commissions per $100k USD traded
- Powerful, purpose-built currency trading platforms like MT4, MT5, TradingView, cTrader and NinjaTrader
- Monthly cash rebates with FOREX.com’s Active Trader Program
Learn more about FOREX.com powerful trading platform and how you can get started today.

About Jay and Julie Hawk
Jay and Julie Hawk are the married co-founders of TheFXperts, a provider of financial writing services particularly renowned for its coverage of forex-related topics. With over 40 years of collective trading expertise and more than 15 years of collaborative writing experience, the Hawks specialize in crafting insightful financial content on trading strategies, market analysis and online trading for a broad audience. While their prolific writing career includes seven books and contributions to numerous financial websites and newswires, much of their recent work was published at Benzinga.