The shooting star candlestick pattern is characterized by a distinct shape that resembles a shooting star. It holds valuable insights into market sentiment and can signal a potential trend reversal. By learning to identify and interpret this candlestick correctly, forex traders can gain an edge in predicting future exchange rate movements and improve their chances of profiting from them.
This article delves into the intricacies of this popular candlestick chart pattern and explores how forex traders can effectively incorporate it into their trading strategies to enhance their trading profits. It will provide a comprehensive overview of the shooting star candlestick pattern, including what it looks like, what it tells you and how to trade using it.
What is the Shooting Star Candlestick?
The shooting star candlestick is a crucial bearish pattern in technical analysis that forex traders frequently rely on to make trading decisions. It appears at the end of an uptrend and suggests a potential downside reversal in the exchange rate.
The shooting star candle derives its name from its resemblance to a shooting star, with a small red or green body and a long upper shadow or wick. In contrast, a doji candlestick has no body other than a straight line since its opening and closing price levels are identical, while a spinning top candle has a short body vertically centered between its long upper and lower shadows. A schematic diagram showing how the shooting star candle might look on an exchange rate chart appears below.


Traders typically identify the shooting star candlestick by its distinctive characteristics. It consists of a candle with a short body that can be of either color and a long upper shadow with a length more than twice that of the body. The lower shadow is very small or even non-existent, as shown in the above schematic image of a shooting star candle. Note that both the green (or white) and red (or black) versions of the shooting star are thought to be valid, although the bearish red or black candle is considered more powerful since its close is located at the very bottom of the candle.
The significance of the shooting star candlestick lies in its interpretation within the context of the prevailing exchange rate or price trend. When a shooting star forms after a sustained uptrend, it suggests that buying interest is losing momentum, and sellers may be gaining control. The long upper shadow indicates that the exchange rate reached a high point during the trading period but such levels were subsequently rejected, leading to a potential downside reversal in the exchange rate.
Forex traders observing the shooting star candlestick will often look for confirmation signals to support any trading decision based on it. Such signals may include using additional technical indicators to validate the potential reversal and strengthen the overall trading strategy, including a nearby trend line, relevant support and resistance levels, momentum oscillators, trading volume and even other candlestick patterns.
What Does the Shooting Star Candle Tell You?
The shooting star candlestick pattern offers valuable insights to forex traders, providing indications of potential market reversals and bearish shifts in sentiment. When identified correctly, a shooting star candle can offer guidance on the future direction of the exchange rate.
Most importantly, the shooting star candle acts as a bearish reversal signal. It typically appears after a sustained uptrend and signals a possible shift lower in the market. Traders interpret this pattern as a sign of weakening buying pressure and a potential takeover by sellers that can potentially lead to a corrective downward move. This signal can prompt traders to reevaluate their bullish positions, establish shorts and consider adjusting their strategies accordingly since the market will probably enter a corrective phase to the downside.
The shooting star candlestick also indicates a significant resistance level in the market. The long upper shadow represents a failed attempt by buyers to push an exchange rate higher. It suggests that the exchange rate encountered strong resistance at the upper level of the candle, causing selling pressure to emerge and overpower the buying pressure. This observation might lead a forex trader to anticipate a struggle for the market to sustain upward momentum that can potentially lead to a downside reversal or a period of consolidation.
The shooting star candlestick pattern reflects the presence of selling pressure. The extended upper shadow signifies that sellers are actively participating and willing to sell at higher exchange rates. Such selling pressure suggests a potential shift in market sentiment towards bearishness. Forex traders interpret this as an opportunity to consider closing out longs, establishing short positions or at least tightening the stop-loss levels on existing long positions.
While the shooting star candlestick pattern provides valuable information to forex traders, they should generally also seek confirmation signals from other technical sources to strengthen their trading decisions. This helps them reduce the risk of false signals and enhance the accuracy of their trading strategies.
Example of Trading the Shooting Star Candlestick
Now consider an example of how a forex trader might trade a shooting star candle to illustrate its application in practice using the EUR/USD currency pair. The EUR/USD exchange rate has been moving in an uptrend for several weeks, with buyers dominating the market. A forex trader has been observing that movement closely on candlestick charts and trading it with a bias to the long side, but they are now becoming concerned about the growing potential for a downside reversal.
They might take the following steps:
- Recognition of shooting star: The trader notices a shooting star candlestick appear on the daily chart for EUR/USD. It is characterized by a small red body and a long upper shadow that extends above the body to at least twice the length of the body. They also note that the lower shadow of the candle is non-existent.
- Confirmation: The trader then looks for confirmation signals to strengthen their decision to trade the shooting star candle. They analyze additional indicators such as trendlines, support and resistance levels, momentum oscillators and other candlestick patterns. They see that the shooting star candlestick occurs near a strong resistance level just under a rising trendline and that the Relative Strength Index (RSI) is showing bearish divergence in overbought territory, so these observations further validate the potential reversal in their mind.
- Entry: The trader now initiates a trade according to the procedure laid out in their trading plan. In this case, they decide to enter a short position by covering their longs and selling the EUR/USD currency pair short. Feeling confident, their preferred entry point to sell the market is just below the low point of the shooting star candlestick, but they could also have waited until after a bearish confirmation candle forms in the subsequent trading period.
- Stop loss: To manage the risk of this short position, the trader sets a stop loss order to buy EUR/USD above the shooting star candlestick's high, although they could also have placed it above the most recent swing high. This type of protective order helps limit their potential losses if the market does not reverse to the downside as expected. The stop-loss level can also be modified to take into account additional factors like the trader's risk tolerance and current forex market behavior.
- Take profit: The trader also enters a take-profit buy order to close out their short position at a level based on their profit target and how they view the market's potential for declining. They may choose a conservative target, such as just above a previous support level or a Fibonacci retracement level based on the preceding rally.
- Risk and money management: Proper risk and money management are vital to any trader’s long-term success. A trader should ensure that their position sizes are appropriate considering their account balance, risk tolerance and the distance to the stop-loss level. If profits have already accrued on the short position, then they could use a trailing buy-stop order to protect those profits just in case the market reversed unexpectedly to the upside.
- Trade management: As the trade progresses, the trader can monitor the market and adjust their stop-loss or take-profit levels if needed, based on evolving market conditions and their trade plan. They may move the stop loss to a break-even level or lower once the market moves in their favor to eliminate the risk of loss and protect profits. If the market starts to show signs of waning downside momentum that could lead to a strong upside reversal, they may decide to exit the trade by buying EUR/USD to protect their profits.
By effectively trading the shooting star candlestick pattern, forex traders can capitalize on potential uptrend reversals, manage their risk and optimize their trading strategies for success. Keep in mind that profitable currency trading typically requires adapting your strategy to changing forex market conditions, as well as watching for news and economic data releases that could rapidly affect or even negate what otherwise looks like a decent technical trading opportunity.
How to Trade the Shooting Star Candlestick Pattern
The following sections will explore the key elements of trading the shooting star candlestick pattern, including trade entry, setting a stop loss and taking profits.
Identification and Confirmation
Look for a shooting star candlestick formation after a sustained uptrend. It is characterized by a small candlestick with a short body and a long upper shadow that extends to at least twice the length of the body. It signals a possible downside reversal after a prolonged upwards trend.
Once you have identified a possible shooting star candlestick, seek confirmation signals to strengthen any decision to trade based on it. Analyze additional indicators such as nearby trendlines, support and resistance levels, momentum oscillators or other candlestick patterns.
For example, confirmation can come from the shooting star candlestick forming just below a strong resistance level or if you also see bearish divergence arising in overbought territory on the RSI oscillator.
Trade Entry
Once a shooting star candlestick pattern has been recognized and confirmed for a particular currency pair, it is time to consider closing out longs and entering a short trade in that pair. Since a shooting star candlestick will generally signal a bearish reversal, traders will often initiate a short position by selling the relevant currency pair.
You can aim to enter the short position by selling at an appropriate exchange rate level, such as just below the low of the shooting star candlestick or after a bearish confirmation candle forms immediately subsequent to the shooting star candle.
Stop Loss
To manage the risk involved in trading the active forex market based on a shooting star candle, you will want to either place a stop-loss buy order in the market or watch a set stop-loss level closely if you are continuously monitoring the market.
Putting your stop loss above the shooting star candlestick's high point or the recent swing high may make sense, depending on the overall market context. This helps ensure that if the market moves against your trade, the stop-loss order will be triggered to limit your potential losses, although it still may be subject to order slippage.
Taking Profits
You will also generally want to determine a profit target based on your trading strategy, chosen risk-reward ratio and how you view the market’s potential for movement. For example, conservative traders may choose to set a profit target level to buy back their short position just above a previous support level or a Fibonacci retracement level of the preceding upwards move. It also might make sense to use trailing stops to help you lock in and protect profits gained as the market moves in your favor.
Shooting Star vs. Inverted Hammer
The shooting star and the inverted hammer are two common candlestick patterns encountered by forex traders and used extensively in technical analysis. Although they share similarities, notable differences exist between these patterns in terms of their formation, appearance, market sentiment, significance, confirmation signals and trade execution. Diagrams of these two single-candle patterns and the general market context in which they appear are shown in the image below.
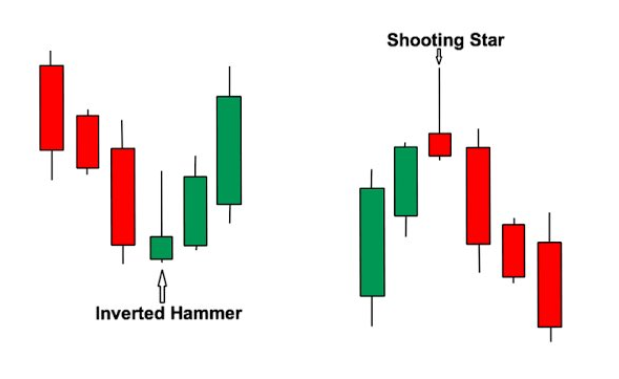
The shooting star candlestick pattern is observed at the end of an uptrend and is characterized by a small bearish candlestick with a very short body that is ideally red or black in color to provide the strongest signal. It possesses a long upper shadow that typically runs at least twice the length of the body, while the lower shadow is usually small or absent. This single-candle pattern suggests a potential bearish reversal in the exchange rate, indicating weakening buying pressure and the possible emergence of sellers who may take control and potentially lead the market into a downward correction.
In contrast, the inverted hammer candlestick pattern emerges at the end of a downtrend. It features a small bullish candlestick, ideally with a short green or white body to give the best signal and a long upper shadow that is generally twice the length of the body. Similar to the shooting star, the inverted hammer exhibits a small or nonexistent lower shadow. This pattern signifies a potential bullish reversal in the exchange rate, suggesting a waning strength of sellers and the potential entry of buyers that could potentially lead to an upward correction.
Regarding trade execution, when trading the shooting star pattern, forex traders typically consider initiating a short position by selling the respective currency pair. They may choose to enter the trade below the shooting star's low or after a bearish confirmation candle forms.
Traders observing an inverted hammer pattern will often contemplate entering a long position by buying the currency pair. They may decide to enter the trade above the inverted hammer's high or after a bullish confirmation candle subsequently develops.
While the shooting star and inverted hammer patterns both offer useful insights into potential forex market reversals, they are best used in conjunction with other technical analysis tools and confirmation signals to support the validity of these patterns and enhance their reliability. Such confirmation signals may include the analysis of additional technical indicators, such as trendlines, momentum indicators, support and resistance levels or other supportive candlestick patterns.
Who Can Benefit From Using the Shooting Star Candle?
The shooting star candlestick pattern can benefit various types of forex traders. Trend reversal traders can capitalize on its bearish signal to identify potential shifts from uptrends to downtrends. Swing traders can also use the shooting star pattern to locate potential turning points and enter short positions ahead of resistance levels and when upside momentum wanes.
Technical analysts can incorporate the single-candle pattern into their analysis, combining it with other indicators to strengthen their trade setups and improve prediction accuracy. In addition, traders can use the shooting star pattern to help define their risk parameters by placing their stop-loss buy orders on shorts above the high of the shooting star to ensure their capital is protected in case the trade does not unfold as anticipated. Price action traders can also leverage the shooting star pattern to identify market sentiment shifts and trade based on supply and demand dynamics.
While many types of traders can benefit from using the shooting star candle, they should remember to avoid using it in isolation. Consider using other technical analysis tools, confirmation signals and the overall market context to make better trading decisions based on the shooting star. You will also need to manage your risk and money appropriately for the best results.
Frequently Asked Questions
Is a shooting star candlestick bullish?
No, a shooting star candlestick is not considered bullish by forex traders since it is a bearish candlestick pattern that indicates a potential downside reversal in the exchange rate’s prior upward trend. It is characterized by a small candlestick body below a long upper shadow that is at least twice the length of the body. This pattern suggests that buying interest is losing momentum, so sellers may take control, leading to a potential decline in the exchange rate.
Is a shooting star a red or green candle?
A shooting star candlestick can be either red or green, but the red (or black) shooting star candles provide the strongest bearish sentiment shift signals. The color of the shooting star candlestick is derived from where the closing exchange rate lies relative to the opening exchange rate for the candle’s observation period. A red candle body indicates that sellers have gained control during the trading period that formed the shooting star, while a green candle body has less bearish implications.
Are shooting star candlesticks reliable?
Yes, shooting star candlesticks are considered to be a reliable technical indicator by forex traders, and these candlestick patterns can provide valuable signals of a potentially bearish reversal to an upward exchange rate trend. Still, since no single indicator is foolproof, traders should use shooting star patterns in conjunction with other technical analysis tools, confirmation signals and an analysis of the market context in which they occur. This helps a trader enhance the reliability of their trading decisions when using shooting star candlesticks.
Get a Forex Pro on Your Side
FOREX.com, registered with the Commodity Futures Trading Commission (CFTC), lets you trade a wide range of forex markets with low pricing and spreads, fast, quality execution on every trade.
You can also tap into:
- EUR/USD as low as 0.0 with fixed $7 commissions per 100,000
- Powerful, purpose-built currency trading platforms like MT4, MT5, TradingView and NinjaTrader
- Monthly cash rebates with FOREX.com’s Active Trader Program
Learn more about FOREX.com powerful trading platform and how you can get started today.

About Jay and Julie Hawk
Jay and Julie Hawk are the married co-founders of TheFXperts, a provider of financial writing services particularly renowned for its coverage of forex-related topics. With over 40 years of collective trading expertise and more than 15 years of collaborative writing experience, the Hawks specialize in crafting insightful financial content on trading strategies, market analysis and online trading for a broad audience. While their prolific writing career includes seven books and contributions to numerous financial websites and newswires, much of their recent work was published at Benzinga.