Trade simple moving average chart patterns with Interactive Brokers.
The simple moving average (SMA) ranks as one of the easiest-to-compute technical indicators. This popular indicator smoothes out price data points and can help you better identify market trends. The SMA can even provide objective signals that can assist you in selecting market entry and exit points as a trader or investor. Benzinga takes a more detailed look at this commonly used indicator below, including explaining how to calculate SMAs and what they can tell you.
What is a Simple Moving Average?
An SMA consists of the moving average of a specific range of periodic market price observations. To obtain 1 data point for this running average, you sum up all the stock price observations in the chosen range and then divide that total by the number of time periods in the range. The average then starts “moving” because you continue to average the price data for that given range by incrementally moving forward 1 period at a time.
In most cases, technical analysts use closing prices for this moving average calculations, but you could also use high, low or opening prices instead. Common observation intervals or periods used for SMAs are daily, hourly and 1-minute observations, while popular numbers of time periods used in SMA calculations include 5, 10, 50 and 200 periods.
SMAs are generally plotted over the price action for the asset they are computed for. An example of a 20-day moving average for Apple Inc. (NASDAQ: AAPL) appears as an orange line in the upper box superimposed over the daily bar chart in the image below.

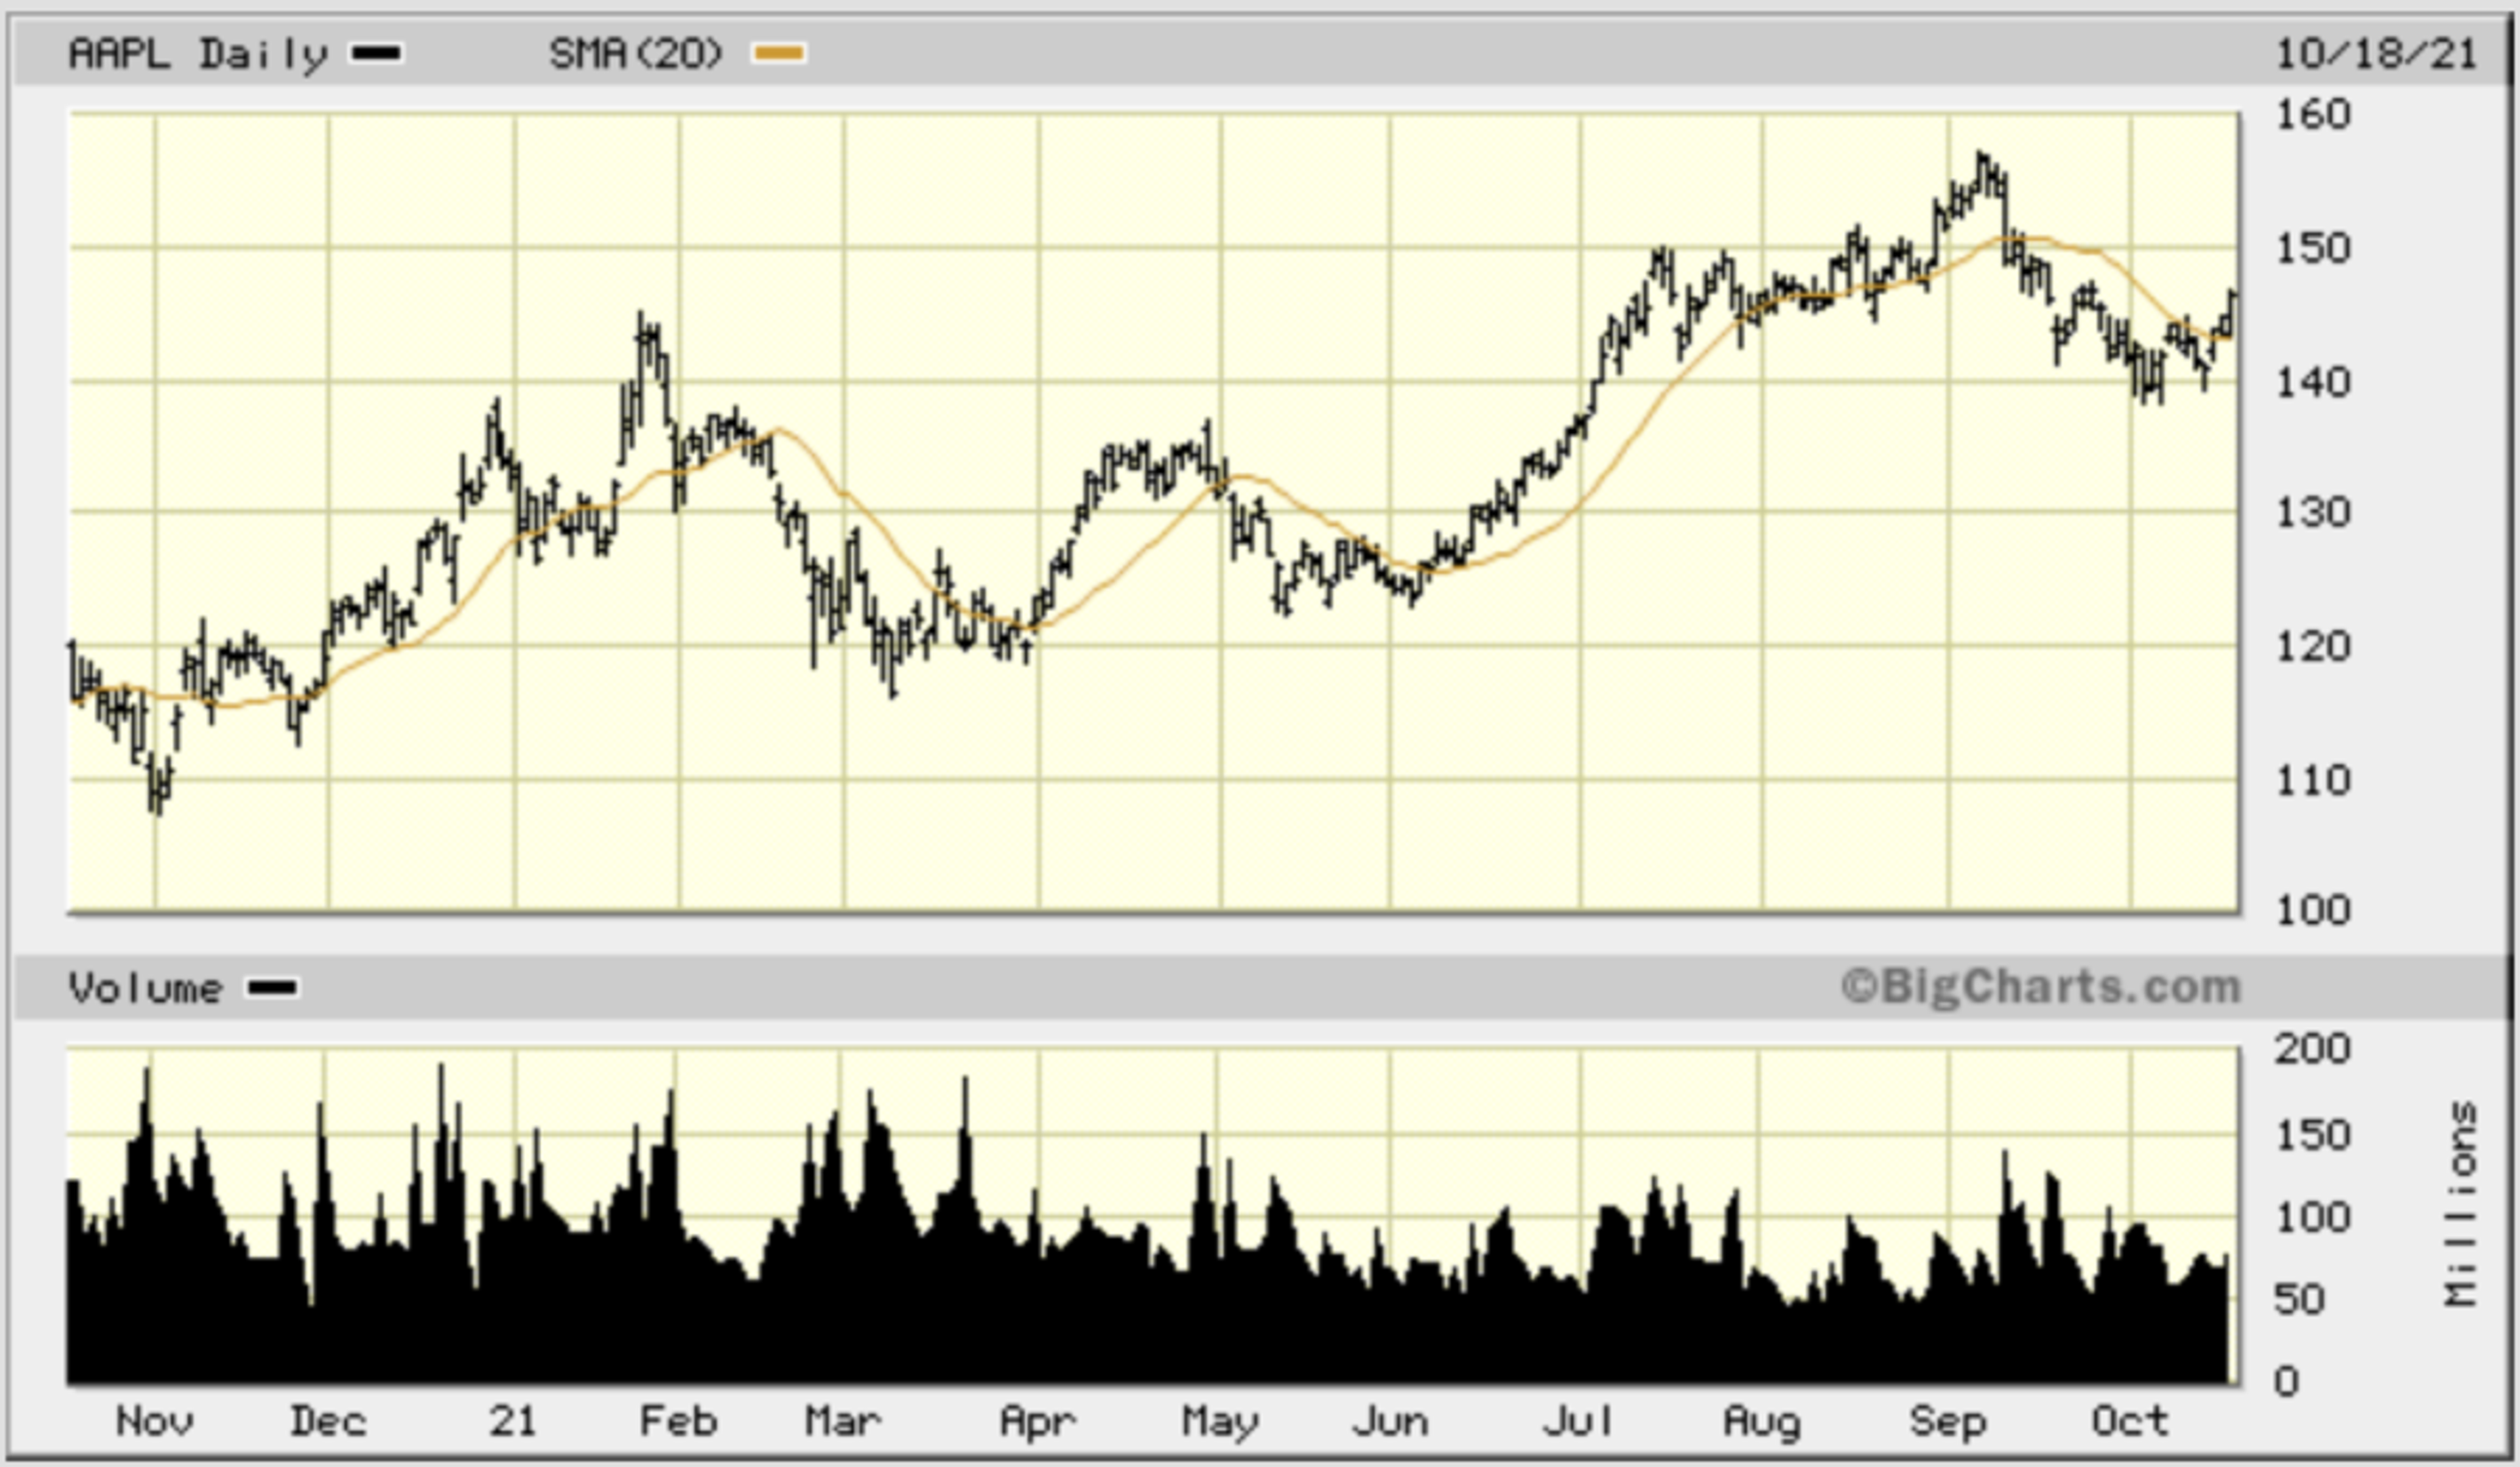
Daily bar chart for AAPL with a 20-day moving average drawn in the upper box in orange and trading volume shown in the lower indicator box. Source: BigCharts.
What is the Simple Moving Average Formula?
The SMA is generally considered one of the most basic trend indicators, and it is quite easy to calculate by hand or using a spreadsheet. The simple moving average formula for computing an SMA is:
SMA=(P1+P2+...+Pn)/n
Where:
Pn = The price of an asset at observation #n.
n = The number of total observations or periods.
For example, computing a 20-day moving average of stock price could involve calculating the average of closing prices observed over the prior 20 days. This average gives you the initial moving average result that can then be plotted on a chart superimposed over the market price for the last day that was included in the average.
To calculate the next SMA result or data point, you remove the first price observed on day 1, add the closing price seen on day 21 and then average the resulting 20 closing prices again. That will give you the second SMA data point to plot along with the market price on day 21.
As another example, consider the following series of 10 daily closing price observations:
P1-10= 10, 13, 15, 11, 12, 15, 17, 18, 20 and 22.
n=10 daily periods
Substituting this data into the SMA equation above yields:
SMA= (10+13+15+11+12+15+17+18+20+22)/10 = 153/10 = 15.3
On the following day, a closing price of 20 is observed. To compute the new SMA value, you remove the 10 price observation from the beginning of the series and add a 20 price observation at the end of the series. This makes the new series of 10 daily closing price observations read as follows:
P1-10= 13, 15, 11, 12, 15, 17, 18, 20, 22 and 20.
Substituting this new data series into the SMA equation above yields:
SMA= (13+15+11+12+15+17+18+20+22+20)/10 = 163/10 = 16.3
This means that the SMA on the first day is 15.3 and that it changed to 16.3 on the following day. Since the SMA is increasing in value, that suggests the market could be in an uptrend.
What Does the Simple Moving Average Tell You?
SMAs smooth out price data and give you an updated average price. As a result, they can help you identify the direction and magnitude of market trends.
For example, you can compute the SMA for an asset and see whether it has a positive or negative slope. If its slope is positive, the SMA is moving higher, and the asset is in an uptrend. Conversely, if its slope is negative, the SMA is moving lower, and the asset’s price is trending downwards.
Furthermore, SMAs can signal when a trend is strong, weakening or in the process of reversing. In a strongly trending market, the SMA generally has a steep slope in the direction of the trend. If the market was previously trending, but the trend is now weakening as it loses momentum, then the SMA will start to level out. If the market is in the process of reversing, then the SMA’s slope will eventually change direction.
Technical analysts often use SMA crossovers to provide them with objective trading signals. To do this, you need to compute a pair of SMAs, with 1 SMA covering a shorter time frame than the other. If the shorter-term SMA is observed to cross up above the longer-term SMA, then that is a bullish or buy signal. On the other hand, if the shorter-term SMA crosses below the longer-term SMA, then that is a bearish or sell signal.
Drawbacks of the Simple Moving Average
One of the main drawbacks of all moving averages, including SMAs, is that they can only look backward at historical price data. As a result, they are considered lagging indicators of future price action.
Another possible downside of using SMAs computed from historical price data is that they should have no bearing on future prices or their direction if markets are indeed efficient in discounting all known information into the current price.
Additionally, when computing an SMA, you must assign equal weights to all values. Some technical analysts think this process can overemphasize the importance of distant price data points and insufficiently emphasize closer price data points.
They might argue that focusing equally on the entire price history covered by the SMA uses too much outdated information instead of more recent — and hence possibly more relevant — price data. Some debate exists about that point, however, since other analysts might prefer to treat all price data points equally.
Which Moving Average is Best?
SMAs are often compared with other types of moving averages, such as exponential moving averages (EMAs). EMAs are frequently preferred by technical analysts because they are more responsive to current price action since they give more recent price data greater weight, which in turn reduces their lag.
The best moving average to use will depend on whether you prefer to emphasize recent price data by weighting it more heavily in your analysis, in which case you might use an EMA, or if you instead want to weight each price data point in exactly the same way, which would make an SMA seem more suitable.
Create Your Trading Strategy With the Best Online Stock Brokers
Compare some of the best online stock brokers.
- Best For:Active and Global TradersVIEW PROS & CONS:Securely through Interactive Brokers’ website
- Best For:Global Broker for Short SellingVIEW PROS & CONS:securely through TradeZero's website


Best Stock Research Platforms
Benzinga has taken the guesswork out of finding a suitable place to research stocks by compiling a list of the best stock research platforms. Check out that list below.


How to Get Started Using Simple Moving Averages
Most online trading platforms, as well as specialized websites and software programs that let you perform technical analysis, will allow you to draw price charts and add technical indicators to them. Fortunately, if you want to include SMAs in your technical analysis, just about all software of this type will support adding that very basic indicator to your price charts.
Typically, once you have a price chart displayed, you need to choose the SMA indicator type and select a time period to compute the SMA over. You might also need to pick a color for the SMA line. That action should allow you to view the SMA’s current value and slope to use in your technical analysis.
If you found this article helpful, then please come back to Benzinga often for more expert information on other technical analysis, investing and trading topics.
Frequently Asked Questions
What is a good simple moving average?
One of the most popular SMAs for short-term technical analysis is the 10-day SMA, which covers about two 5-day trading weeks. Longer-term analysis is often done using 50- and 200-day SMAs.
What does the simple moving average tell you?
The SMA tells you the average price that was computed from a given set of sequential historical price observations. When plotted over the price action for an asset as it evolves over time, the SMA smoothes the price data and can show you the direction of the prevailing market trend.
What is the difference between SMA and EMA?
The Simple Moving Average (SMA) is a widely used technical indicator in stock analysis. It is calculated by taking the average of the closing prices of a stock over a certain period of time. The SMA is typically used to reveal trends and gauge momentum.
The Exponential Moving Average (EMA) is another popular type of moving average that is similar to the SMA but gives more weight to recent prices. The EMA is calculated by taking a certain percentage of the current price and adding it to the previous EMA value. This makes the EMA more responsive to recent price changes than the SMA.

About Jay and Julie Hawk
Jay and Julie Hawk are a married financial writing and authorship team who co-founded TheFXperts, a notable financial writing services provider. The Hawks each worked professionally in the financial markets and have more than 40 years of trading experience among them. Together, they write books, trade forex online for their own account and others, mentor traders, and have worked actively as professional freelance writers specializing in financial topics for over 15 years.