Trends are directional movements generally driven by fundamental factors that shift markets over time. Correctly identifying and trading along with prevailing forex trends often leads to profitable trades.
Knowing how to recognize the different stages of a forex trend can be an invaluable asset to forex traders. Accurate observation of market trends occurring in the foreign exchange market and knowing then they reverse also can translate into significant profits for disciplined currency traders.
In this article, Benzinga explains how trend trading in forex works and how to identify the different stages of forex market trends.
What is a Forex Trend?
A forex trend can be defined as the propensity of an exchange rate to trade in a certain direction over a period of time. Forex trends can occur over long-term, medium-term or short-term time frames. Trends can also move in any direction, including upwards, downwards and sideways.
Many financial markets traders are probably familiar with the market adage that “the trend is your friend” because trading along with the underlying trend usually makes a lot of sense. The strategies of many successful forex traders depend in large on identifying market trends in forex trading and then positioning themselves to profit from the continuation of those trends.
Some forex traders who are often known as swing or momentum traders aim to profit from trend corrections and reversals, as well as from following the trend. They can learn to anticipate these counter-trend exchange rate moves using momentum oscillators like the Relative Strength Index (RSI), the Stochastics Oscillator and the Moving Average Convergence-Divergence (MACD) oscillator.
How Do You Determine Forex Trends?
Depending on the preferred trading style of a currency trader, most trends can be first identified and then traded profitably while they persist. To do this, technical traders will typically peruse exchange rate charts for visual signs of a trend. They might also use various technical trend indicators that generate actionable trend trading signals for both trade entry and exit points.
When a currency pair’s exchange rate is trending higher, it will generally make a series of higher highs and higher lows. After observing this pattern, a chart analyst can then draw two trend lines, one through the set of highs and one through the set of lows.
These two trend lines then can be further analyzed to see if they are parallel. If they are, then a channel pattern is in the process of unfolding that suggests further movement in the direction of the trend remains likely as long as the trend does not reverse enough to break out of the channel.
Traders observing an up channel might aim to buy when the market approaches the lower trend line and take profits when it nears the upper trend line. They could place trailing sell stops below the level of the channel’s lower trend line.
If they noted a down channel on an exchange rate chart, then they might do the opposite by selling on rallies to the upper declining trendline and taking profits when the market falls to approach the lower trendline. Buy stops could be placed above the level of the down channel’s upper trendline.
On the other hand, if the trend lines are instead converging, then a wedge pattern may be forming, which is a reversal pattern that serves as a counter-trend indicator. The appearance of a wedge can indicate that the momentum of the trend is waning, so an astute trader can plan for a reversal in the opposite direction to the trend once the market breaks out of the wedge. This movement occurs when either the lower trendline is broken in an uptrend or the upper trendline is broken in a downtrend.
Most traders tend to determine the direction of the major trend and then try to profit by trading in the trend’s general direction. Technical traders make use of a variety of trend-following tools such as the moving average (MA) crossover and price action to increase their chances of trading profitably.
MAs are lagging technical indicators that smooth out exchange rate data by taking an average of the exchange rate over a period of time. The time period forex traders use to compute an MA varies based on their preferred trade horizon, so it can range from minutes to months.
When two MAs of different time periods — one short and one long — cross over one another on an exchange rate chart, this could indicate a temporary or longer-term direction reversal of the exchange rate has occurred. Some traders use this as a trend-reversal signal.
For identifying long-term trends, traders often observe the 200-day MA plotted against the 50-day MA. Theoretically, the exchange rate trend would be bullish if the 50-day MA remained above the 200-day, but it would turn bearish if the 50-day traded below the 200-day MA. Another popular MA pair monitored by forex traders for medium-term trends is the 10-day versus the 30-day MA pair.
Many short-term strategies also use MA crossovers to generate trading signals, although these MAs might be computed for time periods of minutes rather than days. For example, a day trader could use a 15-minute MA paired with a 1-hour MA and plotted on an hourly exchange rate chart.
While a pair of MAs and their crossovers can generate useful indications about prevailing trends and their reversals, they can also give false signals in practice. Many traders will thus wait for confirmation of the trend or its reversal by another indicator to strengthen the trading signal.
Remember that the pair of trend-following MA indicators may not generate a reliable trading signal on their own, while the trend-confirmation tool can only provide an indication of the trend. Using a combination of the two tends to provide a more reliable trading signal to incorporate into a trading strategy.
For example, if both the chosen pair of MAs and the selected trend-confirmation indicator generate a bullish signal for a particular exchange rate, then a forex trader could look for opportunities to go long that currency pair.
A popular indicator used by many technical traders to confirm trends is the MACD indicator. The MACD line is computed by taking the difference between the 26-period exponential moving average (EMA) and the 12-period EMA. The MACD also includes a nine-period EMA of the MACD line known as the signal line. This smoothed signal line generates buy or sell signals when it crosses over the MACD line.
To read this indicator, a bullish signal exists if the MACD line has crossed from below to above the signal line. When the MACD line moves from above to below the signal line, a bearish signal exists.
How Economic Trends Influence Currencies
A currency’s relative strength in the forex market will generally reflect the economic strength of its issuing nation. A currency can thus seem like the stock of a country when performing fundamental analysis.
Since currencies trade in pairs, however, the economic trends of both currencies in a pair need to be taken into account when forecasting how an exchange rate will probably move.
In general, a strong economy implies a strong currency. When investors recognize a country’s economic strength, they tend to feel more comfortable placing their funds in assets from that country.
Certain countries also produce strategic assets like gold and oil, the value of which can impact the relative value of the associated currency. Examples of these so-called commodity currencies include the national currencies issued by Australia, Canada, South Africa and New Zealand.
Some of the main fundamental factors that can significantly impact a currency’s relative value and drive its exchange rates higher or lower include the following:
- Benchmark interest rates and central bank monetary policy
- Economic data statistics, such as inflation (CPI and PPI) and economic growth (GDP)
- The strength of the country’s stock, bond and important commodity markets
- Trade balances, especially if the country is running a substantial net trade deficit or surplus
- Geopolitical news releases, including election results and natural disasters
Keep in mind that surprises in any of these areas will tend to move the forex market much more than expected results.
Identifying the Stages of a Forex Trend
R.N. Elliott proposed in his Elliott Wave Theory that trends generally unfold in a series of five waves or stages that he numbered one through five. He called the odd-numbered waves that move in the direction of the trend “impulses,” while he called the even-numbered waves that retraced the impulses seen during the trend “corrections.”
After the five-wave trending sequence completes, Elliott postulated that a larger counter-trend correction generally commences that unfolds in either three or five waves that he used letters to mark.
Elliott also noted that corrections can take the following forms:
- Zig-zag: A sharp A-B-C correction that has a 5-3-5 internal wave structure within its larger three waves.
- Triangle: A consolidative or A-B-C-D-E correction with a 3-3-3-3-3 wave internal structure within its larger five waves that progressively decrease in magnitude.
- Flat: A consolidative A-B-C correction with a 3-3-5 wave structure within its larger three waves.
Putting these trending and corrective moves together yields Elliott’s classic eight-wave sequence of trending and corrective movements. He theorized that these movements occur repeatedly and cyclicly in all time frames like a fractal as markets progress over time. A schematic of the eight stages of this cycle is shown in the diagram below.
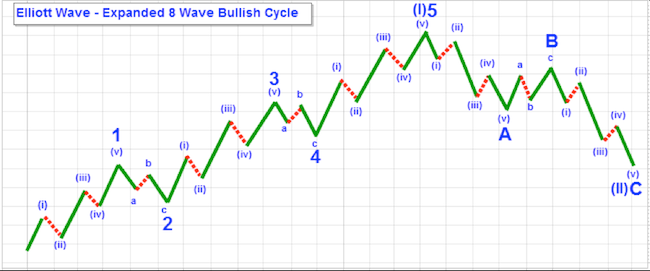
Expanded schematic diagram of an 8-wave bullish cycle, with an initial 5-wave uptrend followed by a 3-wave zig-zag correction. Source: StockCharts.com
Forex traders and analysts using Elliott Wave Theory generally review historical exchange rate activity on charts visually to see if they can identify the current stage or wave of a currency pair’s prevailing trend. They can use this analysis to predict how the market may unfold in the future.
Example of Stages in a Forex Trend
Markets that involve human participation like the forex market typically exhibit several phases or stages of an overall bullish or bearish market cycle. Similarly, economies also expand and contract in a cyclical manner as they move from trough to peak growth over time.
These different stages are shown in the schematic image below.
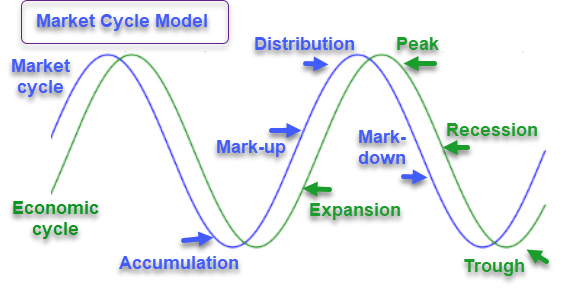
The different stages of market and economic cycles. Source: SeekingAlpha.com
As the image above shows, the market cycles that result in forex trends go through identifiable stages or phases. Many successful currency traders position themselves to take advantage of a new trend when they see a currency pair going through the earlier of these four stages.
The four phases of a market cycle and the psychology that drives each stage are listed and explained further below:
1. Accumulation Phase
This phase typically begins at the end of a prolonged decline in an exchange rate. It begins when an exchange rate is near its lowest point and most retail forex traders lack the confidence to take long positions, due in large part to the losses they incurred in going long over the previous declining phase. This initial stage marks when smart money traders begin to sense value and opportunity, so they enter buy orders at key support points. The presence of these orders keeps the market from falling, which then attracts more buyers. Many experienced traders prefer to avoid buying at the absolute bottom and instead await further confirmation of a directional reversal before moving into the market.
2. Mark-up Phase
After the accumulation phase has resulted in more positive market sentiment, more traders will step in to take long positions, which marks the exchange rate up even further and generates increasing enthusiasm for the new upward market trend. Many inexperienced forex traders do not begin buying until the end of this mark-up stage when they often go long the market in fear of missing out on the strengthening upward move.
3. Distribution Phase
As this phase starts, professional selling interest has been exhausted, causing the exchange rate and market confidence in the upward trend to rise to new swing highs. Retail forex traders and other members of the public with little or no professional trading experience start to enter the market, usually close to the top of the move. As these novices buy near the top of the market and this stage progresses, the smart money starts distributing their long positions to take profits and sell into this strength that is now largely based on public interest. The distribution phase typically displays considerable overlapping exchange rate moves as buyers and sellers compete for dominance. The market eventually tops out and begins to decline as this stage completes.
4. Mark-Down Phase
In this stage, the market has already topped out and continues declining as professionals increasingly establish shorts, although inexperienced traders often stick with their long positions waiting and hoping for one last rally that does not materialize. As the general public begins to lose confidence in the currency pair’s ability to rally, selling interest increases even further. The exchange rate’s decline accelerates until it loses momentum and the market once again finds itself in an accumulation phase as the cycle repeats itself.
Trends vs. Ranges
When analyzing an exchange rate chart, a key question to answer is whether an actual trend exists in the forex pair or whether the assumed trend is just part of a sideways trading range and will soon be reversed.
Successful forex trend traders usually learn to discern when a trend begins so that they can strategically position themselves to profit from it by trading in the same direction. They also take educated guesses about where and when the trend is likely to end.
Many successful forex traders also make substantial profits from trading the ranges that appear regularly on exchange rate charts. Performing technical analysis on charts for each of the currency pairs you choose to trade can give you insight into whether the exchange rate is following a major trend or is stuck repeatedly reversing its direction in a ranging market.
For example, observing channel patterns where the exchange rate moves directionally between two parallel trend lines can help you discern a trend. In contrast, ranging markets typically progress between two parallel horizontal lines. When an exchange rate is moving between two trend lines, it will typically trade near one trend line and then return to approach the other trend line.
Using MAs to smooth exchange rate fluctuations can help you see underlying up or down trends forming on an exchange rate chart. Other popular indicators technical traders use to confirm trends and identify reversals are the RSI and Fibonacci retracement levels.
Even if you trade the prevailing trend, the forex market’s volatility can make you lose money on your stop-loss orders even if you’ve correctly identified the trend’s direction. Nevertheless, if you have the temperament you can range trade within the prevailing trend, which makes more sense than trying to hold positions to profit from a long-term move.
How Viable is Trend Trading in Forex?
When investing in stocks, you can identify a promising company using fundamental analysis and invest in its stock that could then trend higher for years. In contrast, the fundamental factors that affect one currency’s relative valuation against another currency might seem overwhelming for a forex trader to research.
Keep in mind that geopolitical events that can affect currency valuations are constantly occurring and often show results that can surprise the market. In addition, world trade, economic factors and central bank monetary policy all play a complex part in a currency’s relative valuation in the forex market. These factors make trend trading the forex market based on fundamental factors rather more challenging than investing in stocks.
Looking to profit from long-term trends in the forex market may not be the easiest or most profitable trading strategy to trade unless you have deep enough pockets to weather significant adverse moves.
Accordingly, the majority of retail traders will probably find that forex trend trading is best done based on a medium- or short-term outlook. Range trading during consolidation periods that occur periodically can also make sense to include in a trading plan depending on the trader and their chosen strategy.
Frequently Asked Questions
Should you always trade with the trend?
The trend is your friend has long been a key trading maxim and strongly recommends trading along with the prevailing trend, although swing traders and value traders can make money when trading against the trend if they look for clear signs that the trend’s momentum is waning and hence likely to correct.
What is the best forex trend indicator?
Many forex traders use moving averages to smooth exchange rate movements sufficiently to help them identify a trend and its direction. Some traders also use the Average Directional Index (ADX) indicator developed by Welles Wilder to identify how strong the prevailing trend is.
How do you find a strong trend?
Observing a series of higher highs and higher lows signals an uptrend is in progress while seeing a set of lower highs and lower lows will indicate a downtrend exists. Plotting a moving average and observing how slanted it is can also give you a sense of a prevailing trend’s strength since the closer to vertical the moving average’s slope is, the stronger the trend.