
8 analysts have expressed a variety of opinions on Freeport-McMoRan FCX over the past quarter, offering a diverse set of opinions from bullish to bearish.
Summarizing their recent assessments, the table below illustrates the evolving sentiments in the past 30 days and compares them to the preceding months.
| Bullish | Somewhat Bullish | Indifferent | Somewhat Bearish | Bearish | |
|---|---|---|---|---|---|
| Total Ratings | 2 | 1 | 5 | 0 | 0 |
| Last 30D | 1 | 0 | 0 | 0 | 0 |
| 1M Ago | 0 | 0 | 0 | 0 | 0 |
| 2M Ago | 1 | 1 | 5 | 0 | 0 |
| 3M Ago | 0 | 0 | 0 | 0 | 0 |
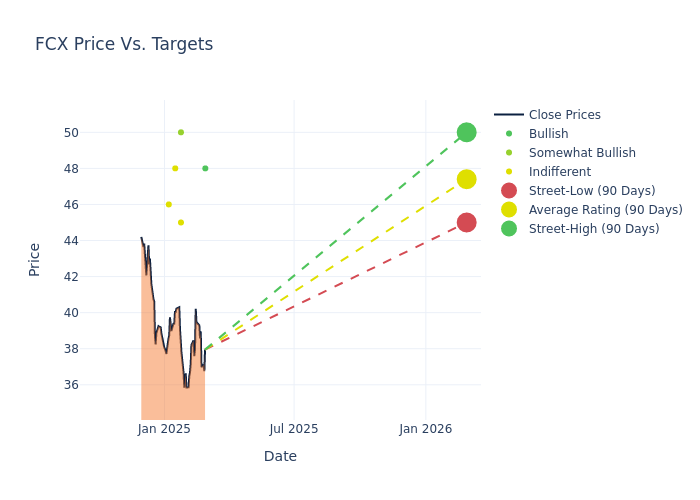
Insights from analysts' 12-month price targets are revealed, presenting an average target of $46.62, a high estimate of $50.00, and a low estimate of $40.00. This current average represents a 8.59% decrease from the previous average price target of $51.00.
Interpreting Analyst Ratings: A Closer Look
In examining recent analyst actions, we gain insights into how financial experts perceive Freeport-McMoRan. The following summary outlines key analysts, their recent evaluations, and adjustments to ratings and price targets.
| Analyst | Analyst Firm | Action Taken | Rating | Current Price Target | Prior Price Target |
|---|---|---|---|---|---|
| Chris LaFemina | Jefferies | Raises | Buy | $48.00 | $40.00 |
| Orest Wowkodaw | Scotiabank | Lowers | Sector Perform | $45.00 | $48.00 |
| Katja Jancic | BMO Capital | Lowers | Outperform | $50.00 | $54.00 |
| Chris LaFemina | Jefferies | Lowers | Hold | $40.00 | $48.00 |
| Bill Peterson | JP Morgan | Lowers | Neutral | $48.00 | $55.00 |
| Bob Brackett | Bernstein | Lowers | Market Perform | $46.00 | $51.00 |
| Orest Wowkodaw | Scotiabank | Lowers | Sector Perform | $48.00 | $52.00 |
| Chris LaFemina | Jefferies | Lowers | Buy | $48.00 | $60.00 |
Key Insights:
- Action Taken: In response to dynamic market conditions and company performance, analysts update their recommendations. Whether they 'Maintain', 'Raise', or 'Lower' their stance, it signifies their reaction to recent developments related to Freeport-McMoRan. This insight gives a snapshot of analysts' perspectives on the current state of the company.
- Rating: Providing a comprehensive analysis, analysts offer qualitative assessments, ranging from 'Outperform' to 'Underperform'. These ratings reflect expectations for the relative performance of Freeport-McMoRan compared to the broader market.
- Price Targets: Analysts gauge the dynamics of price targets, providing estimates for the future value of Freeport-McMoRan's stock. This comparison reveals trends in analysts' expectations over time.
Analyzing these analyst evaluations alongside relevant financial metrics can provide a comprehensive view of Freeport-McMoRan's market position. Stay informed and make data-driven decisions with the assistance of our Ratings Table.
Stay up to date on Freeport-McMoRan analyst ratings.
Unveiling the Story Behind Freeport-McMoRan
Freeport-McMoRan owns stakes in 10 copper mines, led by its 49% ownership of the Grasberg copper and gold operations in Indonesia, 55% of the Cerro Verde mine in Peru, and 72% of Morenci in Arizona. It sold around 1.2 million metric tons of copper (its share) in 2024, making it the one of the world's largest copper miners by volume. It also sold about 900,000 ounces of gold, mostly from Grasberg, and 70 million pounds of molybdenum. It had about 25 years of copper reserves at end December 2024. we expect it to sell similar amounts of copper midcycle in 2029, though we expect gold volumes to decline to about 700,000 ounces then due to falling production at Grasberg.
Freeport-McMoRan: Delving into Financials
Market Capitalization: Boasting an elevated market capitalization, the company surpasses industry averages. This signals substantial size and strong market recognition.
Negative Revenue Trend: Examining Freeport-McMoRan's financials over 3 months reveals challenges. As of 31 December, 2024, the company experienced a decline of approximately -3.13% in revenue growth, reflecting a decrease in top-line earnings. In comparison to its industry peers, the company trails behind with a growth rate lower than the average among peers in the Materials sector.
Net Margin: Freeport-McMoRan's net margin falls below industry averages, indicating challenges in achieving strong profitability. With a net margin of 4.79%, the company may face hurdles in effective cost management.
Return on Equity (ROE): The company's ROE is below industry benchmarks, signaling potential difficulties in efficiently using equity capital. With an ROE of 1.56%, the company may need to address challenges in generating satisfactory returns for shareholders.
Return on Assets (ROA): The company's ROA is below industry benchmarks, signaling potential difficulties in efficiently utilizing assets. With an ROA of 0.5%, the company may need to address challenges in generating satisfactory returns from its assets.
Debt Management: Freeport-McMoRan's debt-to-equity ratio stands notably higher than the industry average, reaching 0.55. This indicates a heavier reliance on borrowed funds, raising concerns about financial leverage.
Analyst Ratings: Simplified
Analysts work in banking and financial systems and typically specialize in reporting for stocks or defined sectors. Analysts may attend company conference calls and meetings, research company financial statements, and communicate with insiders to publish "analyst ratings" for stocks. Analysts typically rate each stock once per quarter.
Some analysts will also offer forecasts for metrics like growth estimates, earnings, and revenue to provide further guidance on stocks. Investors who use analyst ratings should note that this specialized advice comes from humans and may be subject to error.
Which Stocks Are Analysts Recommending Now?
Benzinga Edge gives you instant access to all major analyst upgrades, downgrades, and price targets. Sort by accuracy, upside potential, and more. Click here to stay ahead of the market.
This article was generated by Benzinga's automated content engine and reviewed by an editor.
© 2025 Benzinga.com. Benzinga does not provide investment advice. All rights reserved.
date | ticker | name | Price Target | Upside/Downside | Recommendation | Firm |
|---|
Trade confidently with insights and alerts from analyst ratings, free reports and breaking news that affects the stocks you care about.

