After looking at over 500 charts and posting my thoughts on many of them, I have found some good setups for the week. This week's mix contains 4 long ideas with 4 short setups, and three breakouts. These were selected in and should be viewed in the context of the broad market trend, reviewed Friday, which looks like there may be a pullback or at least a rest for Gold and a rest or maybe a rise for the US Dollar Index. US Treasury Bonds are on support but look weak and headed lower. Although Oil looks strong, it is at resistance and may need some time to work through it. Volatility seems to have found a bottom, although still weak, which should allow stocks to continue their move higher, towards a test of the top of the four month (or maybe one year?) channel.
Here are the top ten for the week in no particular order:
1. Canadian Solar, Ticker: CSIQ

Canadian Solar has just come out of a symmetrical triangle and had trouble moving higher with the 100 day Simple Moving Average (SMA) as resistance at 12.63. If it can get through it then the next resistance is at 13.50 followed by 14 and 16. The rising 50 day SMA is support at 12.17, and looks to help it get higher.
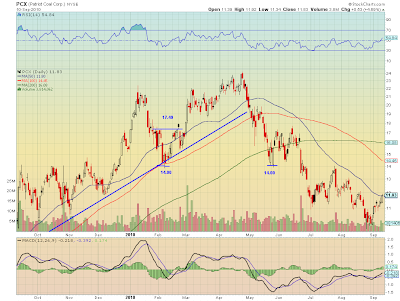
2. Patriot Coal, Ticker: PCX

Patriot Coal broke through the rising 50 day SMA Friday and is at a resistance area near 12 now. If it can get through 12 then the next resistance level is at 13 followed by 14. The rising Moving Average Convergence Divergence (MACD) and Relative Strength Index (RSI) also point to it going higher. The 50 day SMA at 11.80 will act as support now, with additional support lower at 11.50.
3. Cirrus Logic, Ticker: CRUS

Cirrus Logic had a rough week and it looks to get worse still. It lost the support of the 100 day SMA Friday and is at support near 15 from the beginning of July and late August. The 100 day SMA will now be resistance. If it falls under 15 the next support area is near 13 and then 11.63. The rolling SMA's, declining MACD and RSI all signal lower.
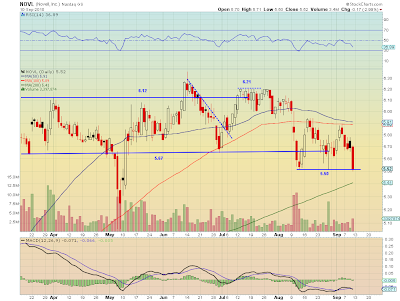
4. Novell, Ticker: NOVL

The down move on Novell stalled Friday at 5.50 which has been support previously in August. It looks to break this resistance level and test 5.40 and then 5.08, with a falling RSI and the MACD cross Friday. The 50 day SMA is also coming close to crossing down through the 100 day SMA which will add to the bear case.
5. Power-One, Ticker: PWER

Power-One has been bouncing off of resistance at 11.21 for several days now after a previous attempt in mid August. The rising trend line, shadowing the 50 day SMA now is creating an ascending triangle which is about to resolve. A rising RSI and MACD suggest it will resolve to the upside. If it gets through 11.21 the next resistance is at 13. If it rejects at 11.21 and back through the trend line near 10.20 then next support level is 9.50. A two for one potential play.
6. Shanda Interactive Games, Ticker: SNDA

Shanda double tapped support at 38.00 Thursday and Friday, a previous support level. If it bounces there then resistance is first at 40.67, the 50 day SMA, and then 41.47, the 100 day SMA. If it does not hold then support can be found lower at 36.33 and then 33.90. The prognosis is mixed as the 50 day SMA is starting to rise and the RSI is showing oversold, but the MACD still points negative and the 100day and 200 day SMA are also negatively sloped. Watch and play what it gives you.
7. Skechers, Ticker: SKX

Skechers was another stock that had a rough week. It exploded down through the 50% Fibonacci retracement level of 25 on huge volume Thursday. This level will act as resistance now. Despite the small price movement Friday on still large volume it looks like the selling is not over yet and it is prepping to fall further. If it gets through 22.50, a support level from late 2009, the next support is at 20.37, the 61.8% Fibonacci retracement level, and then 18.50. The MACD just recrossed lower indicating increased probability of this happening, although the RSI is slightly oversold.
8. Aeropostale, Ticker: ARO

Aeropostale has been in a range between 21.67 and 23 for a couple of weeks and is now testing the top of the range. The rising MACD and RSI suggest it might be able to work higher. Above this range it would see resistance at 24 and then 25.93 where the 50 day SMA is crossing down through the 200 day SMA.
9. Huntington Bancshares, Ticker: HBAN

Huntington Bancshares has been trying to break through resistance at 6 the last couple of day. This is also the 100 day SMA. If it can get through, then there is resistance at 6.35 followed by 6.75. The Increasing MACD suggests this is the path of least resistance. If, however, it rejects downward again and through the 50 day SMA at 5.77 then support can be found at 5.50 and then 5.32 lower.
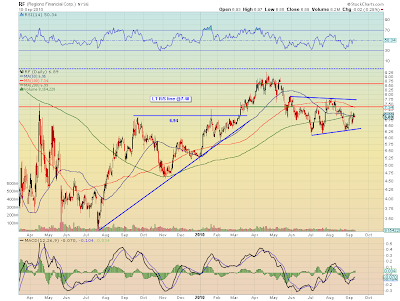
10. Regions Financial, Ticker: RF

Regions Financial stock price has been caught on the 50/200 day SMA cross. It can break either way from here but the increasing MACD and relatively low RSI suggest that it might break higher. If it does then there is resistance at 7.34. If the break is lower then support comes at 6.35.
Bonus Idea: Chimera Investment, Ticker: CIM

This pick may take a while to play out. Chimera Investment, a Real Estate Investment Trust (REIT) has been trading in a narrow and tightening range for over a year after its fall in late 2008. It has met resistance at 4 several times along the way and appears to be breaking out above it now. The RSI has risen lately and the MACD which has been pegged near zero is also starting to rise. If it can detach from the 4 area then it can rise to resistance at 5 but it might take some time. With a near 20% dividend rate you can afford to wait for it to rise.
Have a great week and trade'm well!
Here are the top ten for the week in no particular order:
1. Canadian Solar, Ticker: CSIQ

Canadian Solar has just come out of a symmetrical triangle and had trouble moving higher with the 100 day Simple Moving Average (SMA) as resistance at 12.63. If it can get through it then the next resistance is at 13.50 followed by 14 and 16. The rising 50 day SMA is support at 12.17, and looks to help it get higher.
2. Patriot Coal, Ticker: PCX

Patriot Coal broke through the rising 50 day SMA Friday and is at a resistance area near 12 now. If it can get through 12 then the next resistance level is at 13 followed by 14. The rising Moving Average Convergence Divergence (MACD) and Relative Strength Index (RSI) also point to it going higher. The 50 day SMA at 11.80 will act as support now, with additional support lower at 11.50.
3. Cirrus Logic, Ticker: CRUS

Cirrus Logic had a rough week and it looks to get worse still. It lost the support of the 100 day SMA Friday and is at support near 15 from the beginning of July and late August. The 100 day SMA will now be resistance. If it falls under 15 the next support area is near 13 and then 11.63. The rolling SMA's, declining MACD and RSI all signal lower.
4. Novell, Ticker: NOVL

The down move on Novell stalled Friday at 5.50 which has been support previously in August. It looks to break this resistance level and test 5.40 and then 5.08, with a falling RSI and the MACD cross Friday. The 50 day SMA is also coming close to crossing down through the 100 day SMA which will add to the bear case.
5. Power-One, Ticker: PWER

Power-One has been bouncing off of resistance at 11.21 for several days now after a previous attempt in mid August. The rising trend line, shadowing the 50 day SMA now is creating an ascending triangle which is about to resolve. A rising RSI and MACD suggest it will resolve to the upside. If it gets through 11.21 the next resistance is at 13. If it rejects at 11.21 and back through the trend line near 10.20 then next support level is 9.50. A two for one potential play.
6. Shanda Interactive Games, Ticker: SNDA

Shanda double tapped support at 38.00 Thursday and Friday, a previous support level. If it bounces there then resistance is first at 40.67, the 50 day SMA, and then 41.47, the 100 day SMA. If it does not hold then support can be found lower at 36.33 and then 33.90. The prognosis is mixed as the 50 day SMA is starting to rise and the RSI is showing oversold, but the MACD still points negative and the 100day and 200 day SMA are also negatively sloped. Watch and play what it gives you.
7. Skechers, Ticker: SKX

Skechers was another stock that had a rough week. It exploded down through the 50% Fibonacci retracement level of 25 on huge volume Thursday. This level will act as resistance now. Despite the small price movement Friday on still large volume it looks like the selling is not over yet and it is prepping to fall further. If it gets through 22.50, a support level from late 2009, the next support is at 20.37, the 61.8% Fibonacci retracement level, and then 18.50. The MACD just recrossed lower indicating increased probability of this happening, although the RSI is slightly oversold.
8. Aeropostale, Ticker: ARO

Aeropostale has been in a range between 21.67 and 23 for a couple of weeks and is now testing the top of the range. The rising MACD and RSI suggest it might be able to work higher. Above this range it would see resistance at 24 and then 25.93 where the 50 day SMA is crossing down through the 200 day SMA.
9. Huntington Bancshares, Ticker: HBAN

Huntington Bancshares has been trying to break through resistance at 6 the last couple of day. This is also the 100 day SMA. If it can get through, then there is resistance at 6.35 followed by 6.75. The Increasing MACD suggests this is the path of least resistance. If, however, it rejects downward again and through the 50 day SMA at 5.77 then support can be found at 5.50 and then 5.32 lower.
10. Regions Financial, Ticker: RF

Regions Financial stock price has been caught on the 50/200 day SMA cross. It can break either way from here but the increasing MACD and relatively low RSI suggest that it might break higher. If it does then there is resistance at 7.34. If the break is lower then support comes at 6.35.
Bonus Idea: Chimera Investment, Ticker: CIM

This pick may take a while to play out. Chimera Investment, a Real Estate Investment Trust (REIT) has been trading in a narrow and tightening range for over a year after its fall in late 2008. It has met resistance at 4 several times along the way and appears to be breaking out above it now. The RSI has risen lately and the MACD which has been pegged near zero is also starting to rise. If it can detach from the 4 area then it can rise to resistance at 5 but it might take some time. With a near 20% dividend rate you can afford to wait for it to rise.
Have a great week and trade'm well!
SMASmartstop Self Storage REIT Inc
$32.89-0.63%
Edge Rankings
Momentum-
Growth50.74
Quality-
Value26.53
Price Trend
Short
Medium
Long
© 2025 Benzinga.com. Benzinga does not provide investment advice. All rights reserved.
Posted In:
Benzinga simplifies the market for smarter investing
Trade confidently with insights and alerts from analyst ratings, free reports and breaking news that affects the stocks you care about.
Join Now: Free!
Already a member?Sign in