The market has had a lot to digest lately. The government shutdown and budget talks, Janet Yellen being nominated as the next Fed Chair and the start of earnings season, just to name a few. Overall the market has done well digesting and absorbing the news, and the bulls make a strong argument the uptrend will resume as soon as the circus on Washington ends. But there are a few warnings under the hood. Consider the following breadth charts.
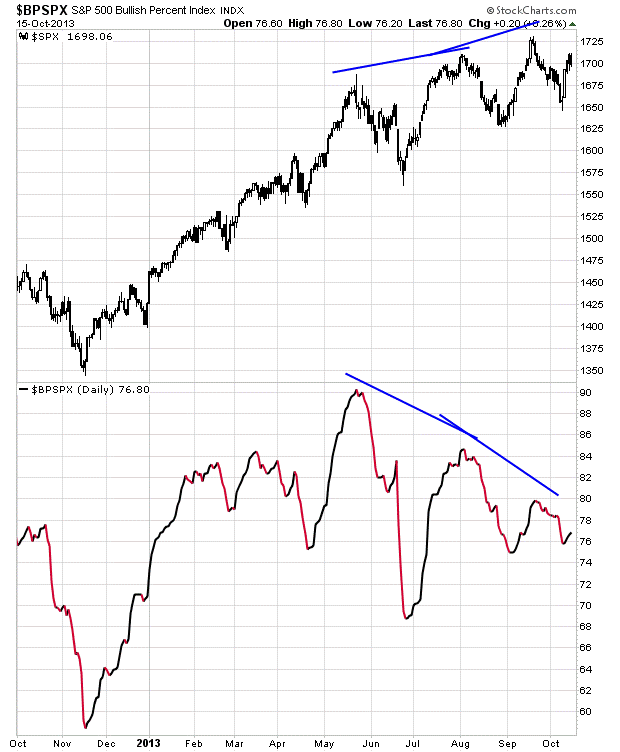
S&P 500 vs. SPX Bullish % Index: The May high was accompanied by a full 90% of the S&P 500 stocks having buy signals on their point-n-figure charts. But at the August high the number dropped to 85%, and at the September high less than 80% had buy signals. Such a divergence, which tells us the market is being carried higher by a smaller number of stocks, can last in the near term, but eventually the lack of broad participation is likely to pull the market down.

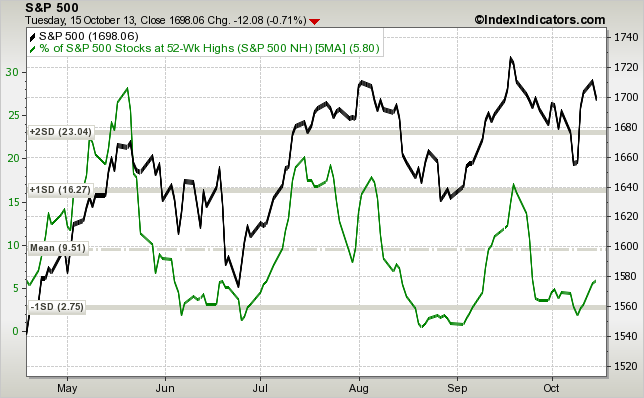
S&P 500 (black) vs. 5-day MA % of SPX Stocks Making New 52-Week Highs (green): In May, when the S&P topped at 1670, about 28% of SPX stocks hit new highs. Then in July and August, when the market topped around 1700, the % of SPX stocks hitting new highs dropped to 18-20% range. Then last month, when the S&P topped near 1730, the % dropped to 17%. Each successive move up saw participation drop. This cannot last. The top stocks can do the heavy lifting for some time, but eventually the internal weakness will be too much to overcome.

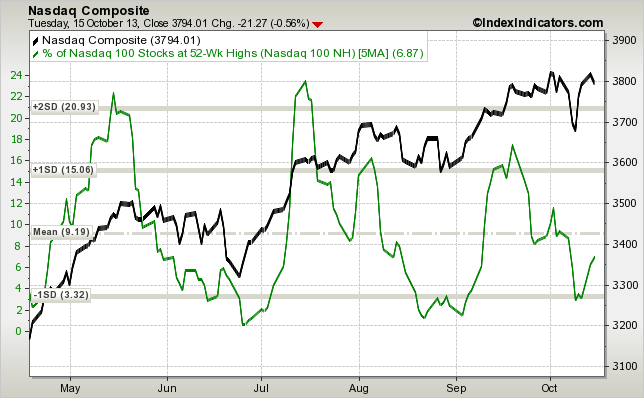
Nasdaq (black) vs. 5-day MA % of Nasdaq 100 Stocks Making New 52-Week Highs (green): And even though the Nasdaq has been leading (it has already hit a new high today), the lack of broad participation is just as noticeable. Not only did the % of NDX stocks hitting new highs drop off in September, the number is currently near its low despite the Nasdaq sitting near a new high.

A resolution is Washington could bring a knee-jerk spike up, but if these breath indicators don't improve, sellers may very well take over.
Market News and Data brought to you by Benzinga APIsS&P 500 vs. SPX Bullish % Index: The May high was accompanied by a full 90% of the S&P 500 stocks having buy signals on their point-n-figure charts. But at the August high the number dropped to 85%, and at the September high less than 80% had buy signals. Such a divergence, which tells us the market is being carried higher by a smaller number of stocks, can last in the near term, but eventually the lack of broad participation is likely to pull the market down.

S&P 500 (black) vs. 5-day MA % of SPX Stocks Making New 52-Week Highs (green): In May, when the S&P topped at 1670, about 28% of SPX stocks hit new highs. Then in July and August, when the market topped around 1700, the % of SPX stocks hitting new highs dropped to 18-20% range. Then last month, when the S&P topped near 1730, the % dropped to 17%. Each successive move up saw participation drop. This cannot last. The top stocks can do the heavy lifting for some time, but eventually the internal weakness will be too much to overcome.

Nasdaq (black) vs. 5-day MA % of Nasdaq 100 Stocks Making New 52-Week Highs (green): And even though the Nasdaq has been leading (it has already hit a new high today), the lack of broad participation is just as noticeable. Not only did the % of NDX stocks hitting new highs drop off in September, the number is currently near its low despite the Nasdaq sitting near a new high.

A resolution is Washington could bring a knee-jerk spike up, but if these breath indicators don't improve, sellers may very well take over.
© 2025 Benzinga.com. Benzinga does not provide investment advice. All rights reserved.
Posted In:
Benzinga simplifies the market for smarter investing
Trade confidently with insights and alerts from analyst ratings, free reports and breaking news that affects the stocks you care about.
Join Now: Free!
Already a member?Sign in