A two-day Federal Reserve meeting begins today to determine whether to raise interest rates for the first time since June 2006. Volume in the stock market tends to drop as investors take a wait-and-see approach to Thursday’s imminent announcement.
Thanks to turmoil in Greece and China, as well as a global stock market sell-off, what once was a forgone conclusion for an interest rate hike in September is now an uncertainty. For example, economists Michael Gapen and Rob Martin at Barclays, who previously expected the Fed to raise rates in September, have now pushed back their call for a first increase in rates to March 2016.
Instead of obsessing over the timing of eventual interest rate hikes to contain inflation, it may be more useful observing the slope of the yield curve to see where the economy and the stock market are headed.
What Is A Yield Curve Exactly?
In case you’re in need of a refresher, a yield curve is a graphical representation of the interest rates and maturities of a group of bonds. Bonds with equivalent risk ratings but varying durations are selected to plot a yield curve.
The U.S. Department Of The Treasury and other financial institutions publish yield curves for investors and lenders to evaluate. Active investors can also plot their own yield curves. Any type of bonds, issuers or category of issuers can be used.
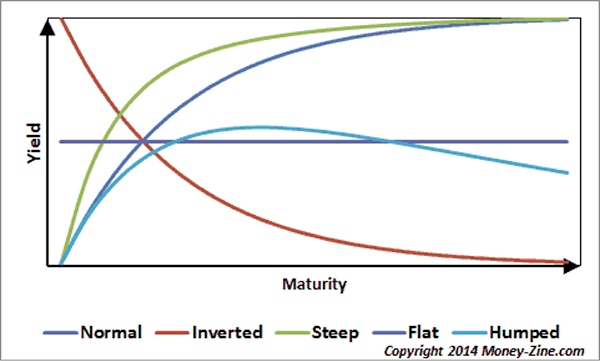
A yield curve typically appears in one of four main shapes: normal, flat, humped or inverted. The shape of a yield curve can provide clues on where the economy, businesses and inflation might be headed. These insights can help you formulate investing ideas and select motifs.

The shape considered a normal yield curve (see above) has lower short-term interest rates than long-term interest rates. An upward sloping yield curve is generally a healthy signal for the economy.
Flat and humped yield curves often signal an economic slowdown ahead. With inflation fears quelled, investors tend to buy longer-term duration instruments thereby lowering yields.
Inverted yield curves, sloping downwards, are often a harbinger for a recession since high short-term interest rates can choke off the money supply.
What Does The Treasury Yield Curve Look Like Now?
The U.S. Treasury yield curve is commonly used as a benchmark and depicts the interest rates of U.S. government Treasuries with three-month, two-year, five-year and 30-year maturities.
It is upward sloping, but has been trending flatter this year.

The Fed’s anticipated rate increase over the next 12 months is likely to keep the front end of the yield curve quite sensitive in the short-term. After all, the Fed controls the absolute shortest end of the yield curve, which is the overnight interbank lending rate, also known as the Fed funds rate.3
Most analysts are not anticipating the Treasury yield curve to invert in the short term. However, some are concerned it might in the coming years if the Fed is overzealous in its desire to combat inflation.
Why Are Yield Curves Important?
Yield curves do not predict future interest rate changes, but rather reflect the market’s expectation about where interest rates and inflation are headed.
Financial institutions use the U.S. Treasury yield curves as a benchmark to determine lending rates for personal loans, mortgages and more.
For example, the 10-year yield is often the key interest rate to determine adjustable rate mortgages. Track the 10-year yield if you’re thinking of refinancing your mortgage.
The yield curve has historically proven to be a respectable economic indicator. A study performed in 2010 at Duke University found that inverted yield curves have forecast the last seven economic declines since 1970.5
This included an inverted yield curve in June 2007, which appeared before the financial crisis. The yield curve in October 2007 was notably flat, and a recession ensued a year later.
Yield Spreads
One final point to look out for is the spread between U.S. Treasury bond yields and corporate bond yields. For example, a widening spread between the 10-year bond yield and corporate bond yields might mean that risk appetites are declining since corporations have to offer higher yields to entice buyers.
This may in turn flash a warning sign for equity investors to begin reducing positions. If corporations only have to offer a tiny spread above the risk-free rate of return, then this signifies a rising risk appetite, a positive sign for equity investors.
Easy Does It
If and when the Federal Reserve raises the Fed funds rate, that’s expected to incrementally flatten the yield curve. However, longer duration yields may adjust according to investor demand.
By gradually raising interest rates in 15-to-25 basis point increments over the next few years, the Federal Reserve would minimize disruptions in the market.
Luckily for investors, the Federal Reserve is not only tasked with maintaining a target level of inflation, but is also focused on the goal of maximum employment.
Focus on expectations for the economy rather than trying to make predictions, and you’ll find yourself making more educated investment decisions going forward.
Ready to get started with Motif Investing? Sign up for a free account today.
Fixed income investments are subject to various unique risks, including changes in credit quality, market valuations, liquidity, prepayments, early redemption, corporate events, tax ramifications, and other factors. Fixed income securities are subject to increased loss of principal during periods of rising interest rates.
Edge Rankings
Price Trend
© 2025 Benzinga.com. Benzinga does not provide investment advice. All rights reserved.
Trade confidently with insights and alerts from analyst ratings, free reports and breaking news that affects the stocks you care about.