Palantir Technology Inc. PLTR shares were trading higher Thursday.
Cathie Wood’s Ark Investment Management ARKK Innovation ETF bought 1,209,900 shares of Palantir, representing about 0.125% of the ETF.
Palantir stock was up 2.47% at $22.42 at last check.
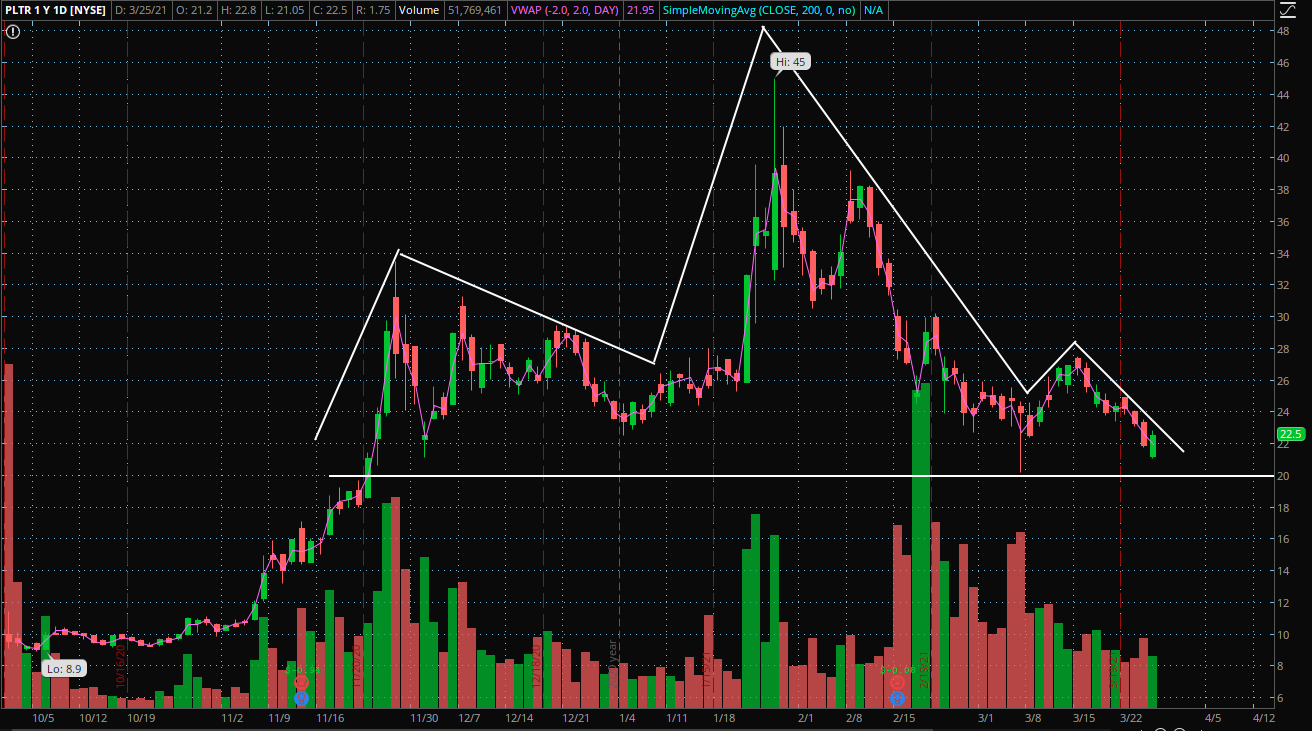
Palantir Daily Chart Analysis: The daily chart above shows that the Palantir stock price is approaching key technical levels and looks to potentially be forming what technical traders call a “head and shoulders” pattern.
The stock previously had resistance near $20 before breaking above, the stock then retested this area and found support near the $20 level. This is an area where the stock could bounce.
The chart looks to be forming a head and shoulders pattern. The pattern is considered to be a bearish reversal pattern. Although the pattern is considered bearish, it may not always act in that manner.
The pattern occurs when the stock runs up and makes a high, consolidates and goes on to make a new high, falls and bounces near support before rising toward the initial high and finally sells off below the initial support.
See also: How to Buy Palantir Technologies (PLTR) Stock
Bulls would like to see the stock bounce near the potential support level of $20 before crossing above the head and shoulders pattern and ending bearish sentiment in the stock. This could indicate the stock is making a reversal upward near support levels.
Bears would like to see the stock fall through the $20 support and consolidate, retesting the price level as resistance, before the stock may make further downward moves.This would confirm the head and shoulders pattern that may be seen on the daily chart.
Photo courtesy of Palantir.
© 2025 Benzinga.com. Benzinga does not provide investment advice. All rights reserved.
Comments
Trade confidently with insights and alerts from analyst ratings, free reports and breaking news that affects the stocks you care about.