These graphs were produced by Capital Market Labs. Learn how the company is bringing the power of living data to the world of finance.
Everyone knows companies restructure in order to lower costs and save money, but sometime investors don’t really KNOW something...until they can see it.
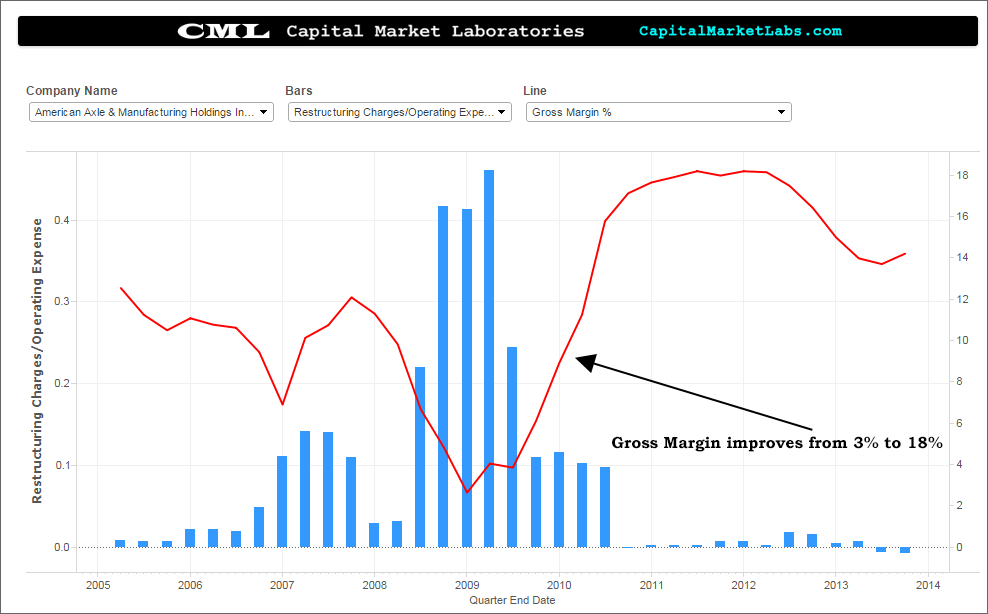
Let’s look at some time series charts of Restructuring Costs/Operating Expenses and Gross Margin percentage, starting with American Axle & Manufact. Holdings, Inc. AXL.
As the blue bars indicate, there was a large restructuring in late 2008/early 2009. That's followed by Gross Margins going through the roof, from 3 percent to 18 percent.

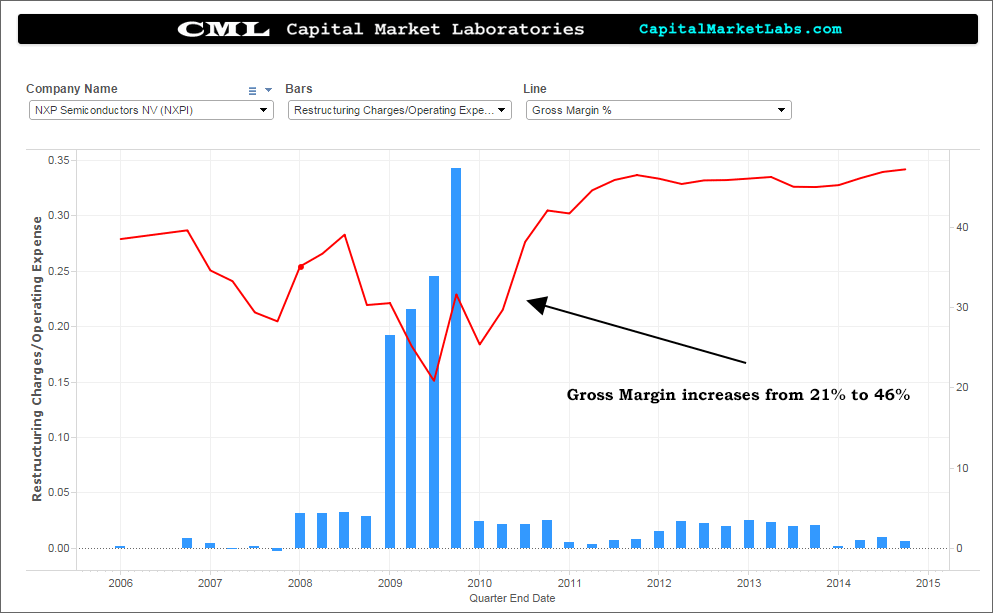
NXP Semiconductors NV NXPI experienced something similar, a 2009 restructuring that was followed by a spectacular jump in gross margins from 21 percent to 46 percent.

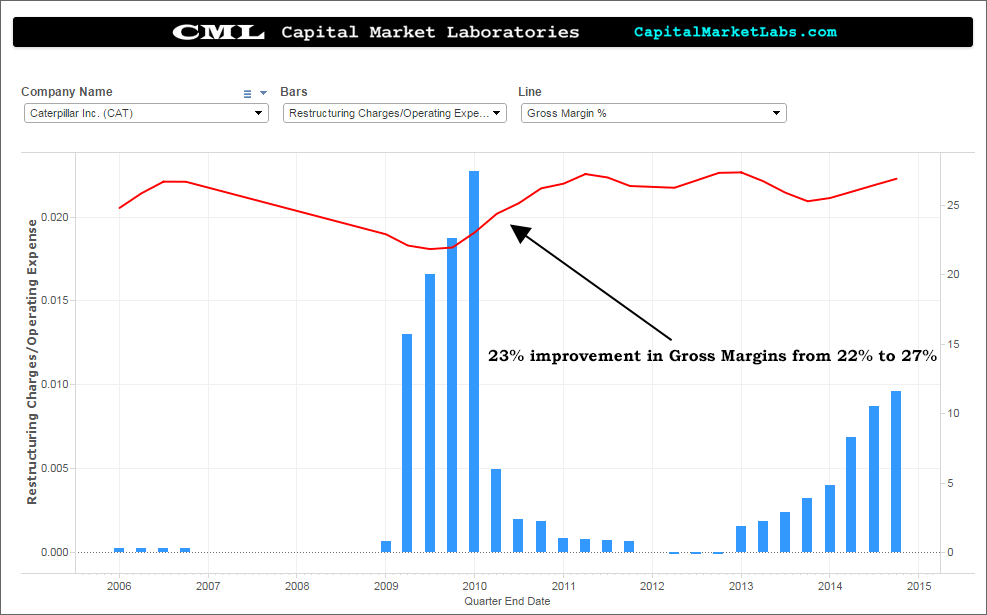
Caterpillar Inc. CAT also had a 2009 restructuring, which led to an improvement in gross margins from 22 percent to 27 percent. In the most recent quarters, yet another surge in restructuring costs is visible.

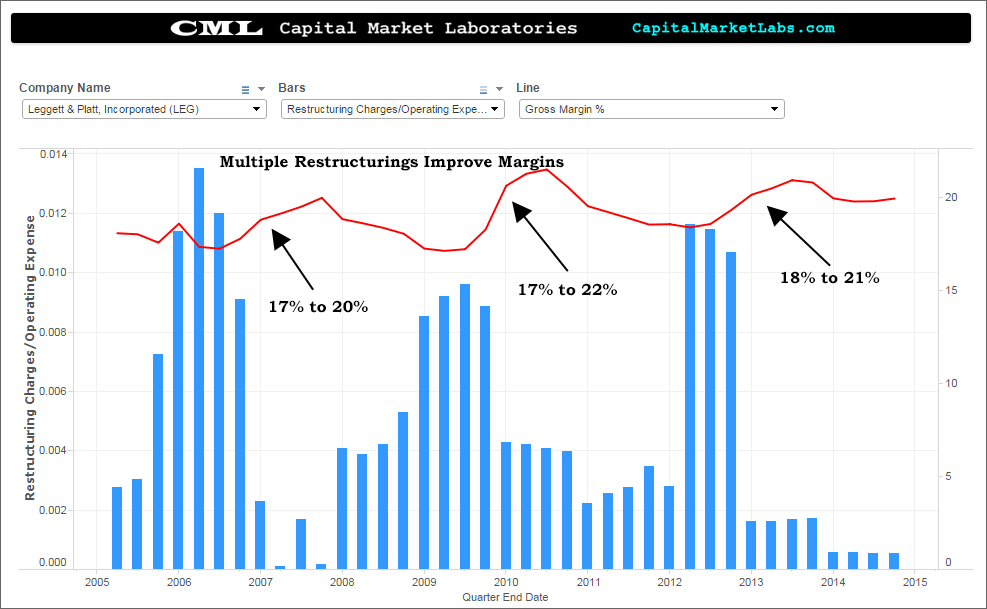
Finally, let's look at Leggett & Platt, Inc. LEG. It has experienced three separate restructuring efforts. Each was followed by an increase in gross margins, which then decayed until the next round of restructuring.

Restructuring sometimes gets a bad rap in the press, as the process can be abused by unscrupulous management to obfuscate unpleasant realities.
While it may be true that the restructuring process is not a panacea to cure any corporate ill, the charts above reveal why it makes sense to consider it.
Tom White can be found on Twitter @tbwhite67
Edge Rankings
Price Trend
© 2025 Benzinga.com. Benzinga does not provide investment advice. All rights reserved.
Trade confidently with insights and alerts from analyst ratings, free reports and breaking news that affects the stocks you care about.