Bookkeeping: Weekly Changes to Fund Positions Year 3, Week 35
Year 3, Week 35 Major Position Changes
To see historic weekly fund changes click here OR the label at the bottom of this entry entitled '
Cash: 70.6% (v 76.0% last week)
18 long bias: 24.6% (v 17.8% last week)
3 short bias: 4.8% (v 6.3% last week) [Includes 1 'long dollar' position]
21 positions (vs 20 last week)
Weekly thoughts
I was reading last week's summary and honestly I should just cut and paste it verbatim with some minor changes. We are now coming off 5 straight weeks of gains; complacency grows by the day. There is very little to add in terms of market discussion - almost every day comes in 2-3 varieties of upwards or sideways action, with a couple of tiny selloffs thrown in the along the way. Last week, 3 of the 4 days were up... in now typical grinding fashion; the majority of the weekly move premarket Thursday. A new Monday approaches and something we flagged almost 5 months ago has now became a standard - magical Monday, which now seem to close in the green at a 95%+ rate. I was hoping for more of a 'blowout' employment number beat Friday so the market would open up in dramatic fashion Monday morning at least creation some sort of playbook for a 'sell the news' reaction but instead a small miss that was "good enough" will just lay the groundwork for the +0.3%, +0.4%, +0.5% days (of which almost all the gains are premarket - first 15 minutes, 80% of the days) So nothing new to report there - I am wondering if I should post my weekly declaration that the market is due to selloff over 1% this week. Maybe by not saying so it will happen...
Off to some charts. On the S&P 500, the 5 day moving average rule continues to work with a 1 point berth (so perhaps make it the 6 day moving average to allow for that extra give or take). The market has not closed below that level since mid February. Further, since the move upward has been so slow motion in nature at times, the longer term moving averages just continue to snake upward and the absolute price level of the market has not shot up ahead of the averages. The same cannot be said for quite a few individual stocks.

Last week we highlighted the 1 major group that had lagged - energy. Lo and behold, this was last week's outperformer as sector rotation happened quite nicely.
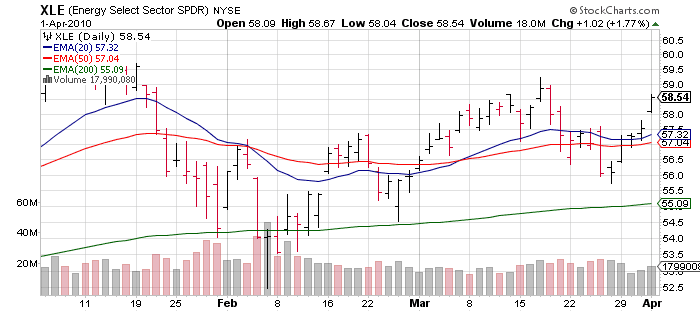
The stocks of oil related companies still lag the commodity which had broken out late last week over Jan 2010 highs - and now sits at the highest level since late 2008.

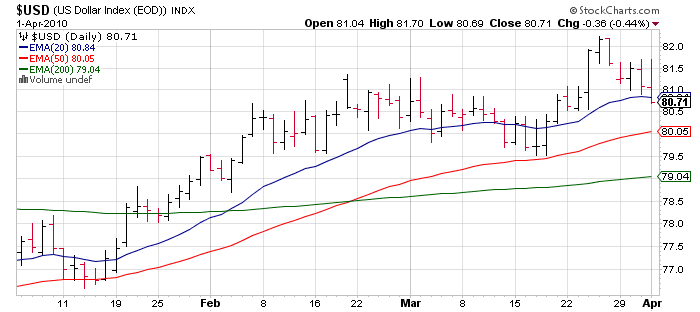
The fact this is happening during a relatively strong period for the dollar is all the more... interesting.
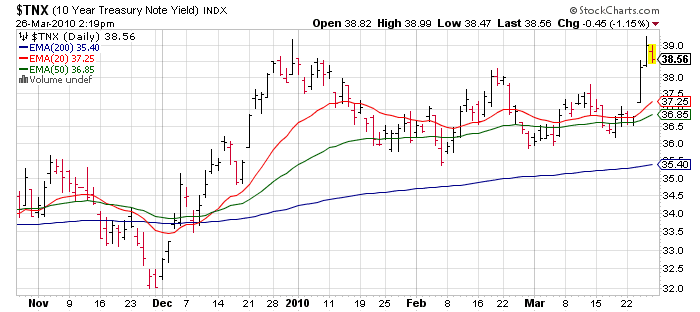
As America looks forward to gas in the low to mid $3's in the coming months, the question now arises can the consumer handle this higher price point, especially when coupled with a potential upward bias in mortgage rates. The market has not sweated a thing in many weeks, so aside from any potential misses in earnings, this would be the next potential discussion point for bears. On a 10 year bond, let us see what the market thinks of a potential move to 4 to 4.25%. (in the chart below that would be "40" to "42.5") Bulls will point to that as a signal of economic strength; bears will say the distressed what me, worry? consumer won't be able to handle the loss of the easiest of money. Certainly it can mean both.
Precious metals, especially of the silver kind also had a nice close to the week.
------------------------------------------------
After last week's ISM Manufacturing, and Friday's jobs report there is nothing that weighty this week in economic reports other than ISM Services Monday (forecast at 54). While ISM Manufacturing gets all the attention, the Services sector is much more in line with the structure of the US economy. With earnings season starting in earnest the week of April 12th with the traditional missed estimates earnings report of Alcoa (AA), we have a dead zone most of this week. Perfect for more low volume, grind it out, and mark it up in premarket action. With perhaps a death defying 0.3% loss thrown in for grins. Until the market reacts poorly to good news (as has happened quite a bit the past 2 earnings seasons) it's hold the course. I'll talk more about earnings season next week, but this will be the last of the "incredibly easy" quarterly comparisons [Jan - Mar '10 v Jan - Mar '09] year over year. Let us keep an eye on some bond auctions this week - 10 years are Wednesday and 30 years Thursday. Two weeks ago some not so great bond auctions caused the market to pause.... for 30 minutes or so. ;)
-----------------------------------------------
For the portfolio a relatively quiet 4 day week. Since I hate chasing all these extended charts, the breakout in oil finally caused a laggard sector to move - which allowed me to start a position in a name that did not have a chart in pure parabolic mode; we restarted a position in Diamond Offshore Drilling (DO). Very strange action in Atheros Communications (ATHR) Thursday - the stock broke to a new high, then spent the rest of the day (while the market rallied) selling off hard. I was hoodwinked as I bought more on the breakout. I closed the last remnant (0.1% exposure) in Telestone Technologies (TSTC) - the stock is not expensive but is extremely volatile and is difficult to trade around on technical terms with so many days it moves 8 to 10%; plus the earnings report last week was not received warmly. There are actually a few other Chinese small cap names getting crushed under the surface but ignored by the broader market - however as with Research in Motion (RIMM) it shows there is still damage to be taken even in such a benign environment. Some smallish index ETF exposure was bought this week as well.
On the short side, it continues to be almost impossible to run any sort of hedged strategy as 90% of stocks now trade over the 50 day moving average. After suffering a poor Q1, Chinese stocks seem to have perked up this past week Morgan Stanley China A Shares (CAF) was closed as the instrument broke out; perhaps a possible long position in fact. And Asia Info Holding (ASIA) I expect to be stopped out on the Monday morning gap up as it was right at my stop loss level Friday at the close... I needed some 1-3% type of market selloff for this name to fill it's gap, but that is too much to ask. Once ASIA goes the only meaningful short I will have is "dollar long" - countless scouts have been sent back to us the past 4-5 weeks with heads detached on the short side; we've been keeping losses small but it is wearisome.
The preceding article is from one of our external contributors. It does not represent the opinion of Benzinga and has not been edited.
© 2025 Benzinga.com. Benzinga does not provide investment advice. All rights reserved.