What We've Done; What We're Doing; What We're Looking At
A very hectic period here - we're in the heart of earnings season, the first real drama has hit the market since July, a concentration of trading activity not seen in many months has hit yesterday, and I'm trying to regurgitate as much as I can in a public outlet in close to real time. Let's just say I slept well last night; but it's a new day.
I thought it would be useful to take a look at a broad array of things I am observing as we try to deconstruct the ever changing puzzle that is the market.
(1) First, let's be clear we have correlations among asset classes like never before. This really started in the middle of 2008 and since then we've been in what I call "student body trading" - either everything is going down, or up. I've said countless times, this is why we obsess with the market direction ... because 80% of your move is based on which way the market is going rather than what stock / ETF you are in. And in the past half year, the added dimension is almost everything is a trade against the US dollar. So what implication does that have? It means individual charts lose some of their meaning as everything is hostage to the US dollar. So let's start there...
[by the way you can enlarge any chart by clicking on it]
As we can see we have a 4 day rally, with 3 of those being "spikey" in nature. This is very overdue since our national peso has been beaten to a pulp for months on end. The question is how sustained will the rally be? The larger (eventual) question will be - when does this inverse dollar correlation ever end? [The Inverse Correlation Between Stocks and the Dollar in 1 Chart] But we can't think that far ahead - the near term questions are, can this dollar get over $77 and if so, can it make a higher high for the first time in many months over $77.50.
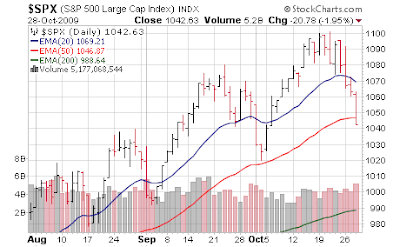
(2) Let's overlay the 2 main indexes - S&P 500 and NASDAQ; similar situations for both, in fact one could argue the NASDAQ ... after being a leader to the upside, has become the leader to the downside.
Both experienced a break of support, the 50 day moving average, yesterday. Not fatal, as in July the S&P 500 for example spent 6 sessions below this support before a furious rally regained the level. But until proven, old support becomes new resistance. And we're looking for new "lower lows" on the S&P 500 that would be a break of 1020 and with the NASDAQ something in the 2030s. Of course this would occur concurrent to (I assume) the dollar index breaking over $77. Remember, it is all just 1 controlled algorithm trade by hundreds upon hundreds of billions of HAL9000 dollars. If those levels break, then the bears appear to be in charge.
(3) Within NASDAQ I want to focus on the semiconductors and I've pulled this back out 1 extra month, to a 4 month chart for a very obvious reason. While technology is a played up financial media sector, it really is just largely a cyclical story with a silicon component... not very different than industrials. Just "sexier". In anticipation of recovery institutional investors have run into "early cycle" stocks - that means semiconductors and industrials. The question that has been hanging over everyone's head is how much of the "semiconductor recovery" is (a) just restocking after the world shut down (b) due to a few specific economies in Asia and (c) actual recovery demand. If only an Asian dependent 6 month restocking story - that's quite bearish. Bulls hope (c) will be the eventual answer, but if not the semiconductor ETF should lead the way down. It's turned for the worse here.
So nothing happens in a vacuum. If dollar rallies, S&P 500 / NASDAQ make new lower lows - the SMH ETF has a great chance to make a run and "fill the gap" around $21.75.
(4) Turning back to the dollar we've had 2 concurrent breakouts about 5 weeks apart - first in gold (September) then oil (October). Gold broke out of a very long range, and once it cleared the low $1000s all the technicians on the Street bought in on the "breakout" along with the weak dollar play (or inflation is yet another reason). Since gold has no real use other than a store of value I can buy those reasons.
Oil on the other hand, was in a 5 month range between $65 and $75 and at the beginning of October broke out, and again - all the same technical oriented computers began buying in bulk. Oil makes little sense to me; the world is awash in it and the largest consumer (hand raised) has a broken economy - but it's become just another trade on the weak dollar, and the "chart is good".
With both gold and oil if you are bullish long term and not just a pure momentum trader who only knows "buy high, sell higher" trading, you want to buy on a pullback to where the base was first exploited to the upside - i.e. lower $1000s for gold (I'm using $1020) and $75 for oil. The assumption being these are healthy corrections in a much larger move up ... or in the current situation, an implicit bet that the dollar will continue to be destroyed by our Federal Reserve. So if we see these 2 commodities break back down into their old ranges (before the break outs) that is bearish for the commodities - bullish for the dollar - and by correlation bearish for everything else in the world.
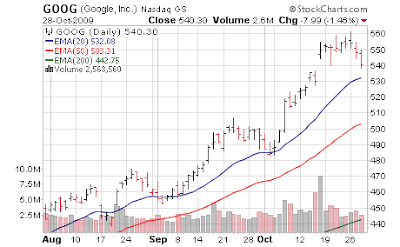
(5) Let's look at our "leadership" stocks - I am going to pick 4. In tech Apple (AAPL) and Google (GOOG), in financials Goldman Sachs (GS), and in commodities Freeport McMoran Copper & Gold (FCX) has become the "go to" stock for this round of "recovery / inflation / the dollar stinks" trade.
Technology names? Both filling gaps, especially obvious in Apple yesterday but just healthy pullbacks for now.
Goldman? Took a bad hit yesterday; broke support cleanly ... looks like a carbon copy of NASDAQ
Freeport? Still fine, just a much needed pullback - below $70 things start to get potentially dicey.
So we have not seen much capitulation if any in our "generals" - only Goldman and in that name, just yesterday.. If this is a just a moderate 5% type of pullback and we're about to reverse back up, these names need not take major hits. But if we have a much deeper pullback, we'd expect to see some serious damage in this group.
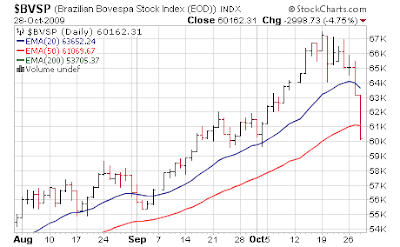
(6) Last, a quick look overseas - in case you missed it since that 2% tax Brazil put on foreign investors due to Ben Bernanke throwing US dollars around the world in a gleeful spree, [Oct 20, 2009: Ben Bernanke's Money Printing Parade Forces Brazil to Slap Tax on Outside Investors] the Brazilian market has taken some big hits; 4.5% yesterday alone.
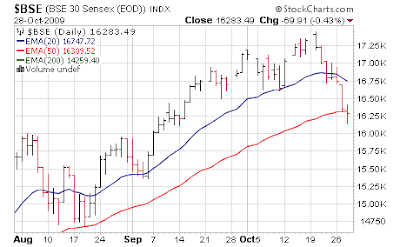
We said Tuesday, India had been looking tired; it sits in a very similar spot to the US markets.
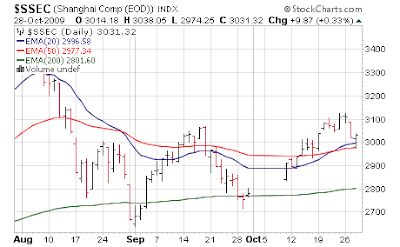
And China has been underperforming for a few months; recall there was a 20%+ correction a few months ago.
But again, all the world has become nothing more than a dollar trade... it is unfortunate this is what has become of things; but with volume dominated by countless machines trading with each other in fractions of a second, the rest of us have become bystanders.. So we have to sit idly by and see if the student body is going to run into the dollar, or out. Any analysis deeper than that is currently fiction. For you readers old enough, just replace "Marsha, Marsha, Marsha" with "Dolla, Dolla, Dolla."
We'll see what the market does with this morning's GDP figure. And how it affects the Marsha dollar.
© 2025 Benzinga.com. Benzinga does not provide investment advice. All rights reserved.


