(Tuesday Market Open) Consumer price growth slowed to a crawl in November, fueling arguments that inflation is starting to ease. Stock futures rallied early Tuesday after the news.
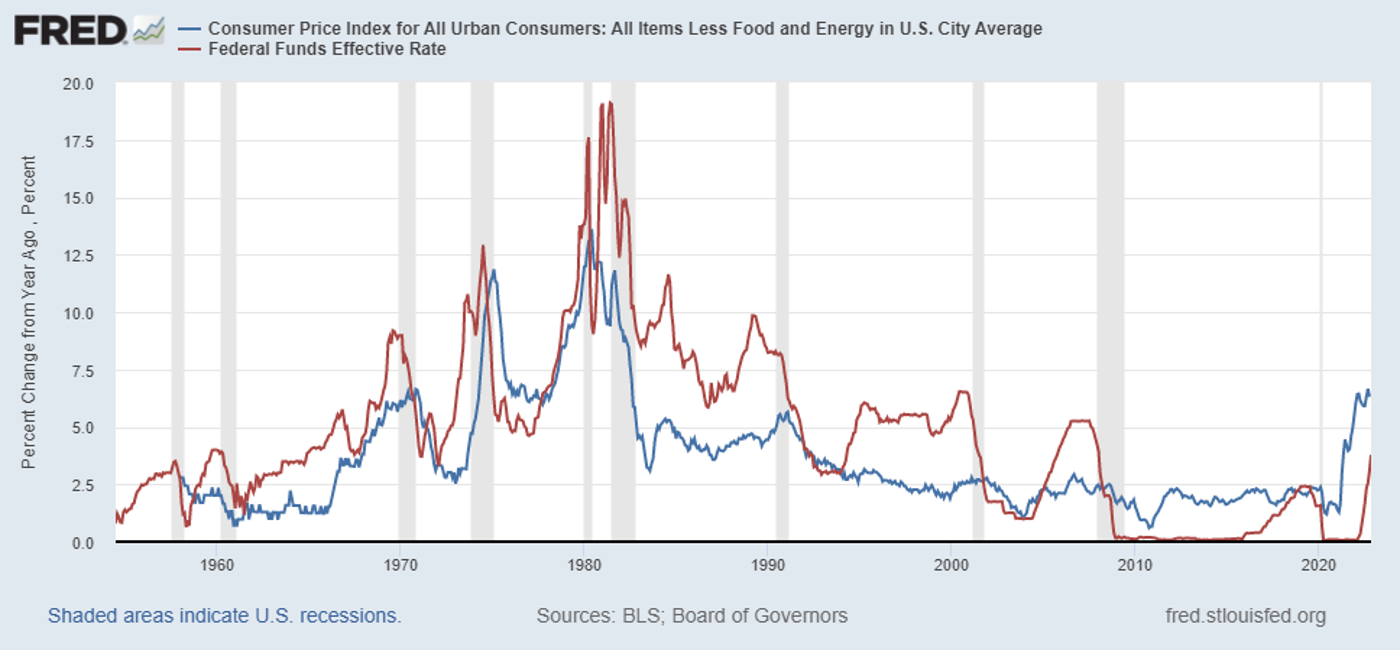
The November Consumer Price Index rose 0.1% versus analysts’ consensus expectations of 0.3%. Core CPI, which strips out volatile food and energy prices, rose 0.2% in November, again below the 0.3% consensus. Prices were up 7.1% from a year earlier.
The headline and core CPI had been 0.4% and 0.3% in October, respectively. Improvement in these month-over-month figures is crucial, and now we’ve had two months in a row of cooling monthly data.
It’s not surprising to see the Nasdaq Composite®($COMP) leading gains after the CPI data, as many growth stocks are more sensitive to higher interest rates. Today’s CPI likely solidifies ideas that the Federal Reserve will hike rates by just 50 basis points tomorrow, down from 75 basis points at its previous four meetings.
In another CPI-related morning development, the 10-year U.S. Treasury yield (TNX) plunged 12 basis points immediately after the report to 3.48%. The 2-year Treasury yield, the most sensitive to the Fed’s interest rate policy, fell even more, and was down 16 basis points at 4.23%.
Inflation data is also rolling in today from outside the U.S. Germany’s November CPI fell to 10% from 10.4% in October and came in near analysts’ expectations. The European Central Bank (ECB) meets this week and analysts expect a 50-basis-point rate increase.
Morning Rush
- The 10-year Treasury yield (TNX) fell 12 basis points to 3.48%.
- The U.S. Dollar Index ($DXY) fell below 104 for the first time since late June.
- Cboe Volatility Index (VIX) futures dropped sharply to just above 22.
- WTI Crude Oil (/CL) is up 0.5% at $73.50 per barrel.
Fed Prepares to Meet
As the Federal Open Market Committee (FOMC) meeting begins this morning, the CME FedWatch Tool projects 79% chances of a 50-basis-point rate hike tomorrow.
In the September dot plot, most FOMC members expected 2022 to end with the benchmark rate between 4% and 4.5%. A 50-basis-point hike tomorrow would get us within that range.
Potential Market Movers
Late yesterday, shares of enterprise software company Oracle (ORCL) jumped 3% in post-market trading following a solid earnings report. Revenue and earnings per share (EPS) beat Wall Street’s estimates, and revenue actually came in $200 million ahead of Oracle’s own expectations, something you don’t hear too much lately.
The company’s closely scrutinized cloud business showed none of the troubles that dimmed recent earnings for some of its competitors. The infrastructure cloud business grew 59% in the quarter and cloud-based applications rose 45%.
While ORCL is just one company, it does have an impressive global footprint. Seeing its cloud business look so healthy could raise spirits about corporate technology spending in general, contrary to the negativity some analysts penciled in after disappointing quarterly cloud performance from Amazon (AMZN) and Microsoft (MSFT).
So why isn’t ORCL up more? Perhaps because of some mixed guidance for the current quarter.
Reviewing the Market Minutes
Here’s how the major indexes performed Monday:
- The Dow Jones Industrial Average® ($DJI) climbed 528 points, or 1.58%, to 34,005.
- The $COMP rose 1.26% to 11,143.
- The Russell 2000®(RUT) added 1.22% to 1,818.
- The S&P 500® index (SPX) rose 56 points, or 1.43%, to 3,990.
Talking Technicals: Last week we noted the SPX continued to find technical support in a range between 3,920 and 3,940. It closed right in the middle of that Friday at 3,934; it then tested that level on an early downturn Monday. When buyers stepped back in, the index quickly pivoted and began putting on weight, ultimately closing at its highest level (3,990) in exactly a week.
Now the level to watch is last week’s 3,998 intraday high and above that the 200-day moving average (MA) of 4,035. Down below, some technicians see 3,955 as a point to watch on any pullbacks. The SPX has traded in a very tight range between roughly 3,900 and 4,080 for a month now, so it’ll be interesting to see if this fresh volatility indicated by the VIX changes that.
Speaking of 200-day MAs, the $DXY closed below its own 200-day MA Monday for the third consecutive session. That particular trendline had been important support for the $DXY for more than a year, but now the net appears to have a hole.
Three Things to Watch
Notable Calendar Items
Dec. 14: FOMC rate decision, quarterly projections and dot-plot, November Export and Import Prices, and expected earnings from Lennar (LEN)
Dec. 15: November Retail Sales, December Empire State Manufacturing, and November Industrial Production and Capacity Utilization
Dec. 16: Expected earnings from Accenture (ACN)
Dec. 19: No earnings or data of note
Dec. 20: November Housing Starts and Building Permits and expected earnings from General Mills (GIS) and Nike (NKE)
Dec. 21: November Existing Home Sales and expected earnings from Rite Aid (RAD) and Micron (MU)
Dec. 22: Government’s final Q3 GDP estimate and expected earnings from CarMax (KMX)
TD Ameritrade® commentary for educational purposes only. Member SIPC.
Image sourced from Shutterstock
This post contains sponsored advertising content. This content is for informational purposes only and not intended to be investing advice.
© 2026 Benzinga.com. Benzinga does not provide investment advice. All rights reserved.
To add Benzinga News as your preferred source on Google, click here.