Is This Rally Nearing an End?
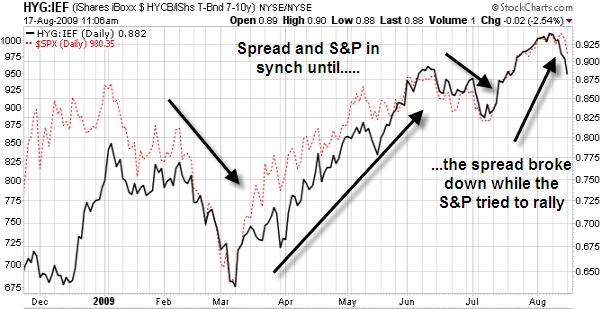
One of the tools I use to measure trader tolerance for risk in the market is the spread between High Yield Bonds (HYG) and 7 – 10 year treasuries (IEF). This spread measures the actual price performance of the bonds (the inverse of yield). In the chart below, I have the HYG:IEF spread (black line) plotted with the S&P 500 (red dashed line). When the black line is rising that means that high yield bonds are favored which signals a healthy appetite for risk. When the black line is falling that means that treasuries are outperforming high yield bonds which signals risk aversion by traders. A healthy appetite for risk is fertile ground for rallies to start and grow. As traders move away from risk, rallies wither and die. I am not saying that this rally is over at this point, but last week’s behavior in this spread could be telling us that traders are slowly moving away from risk.
Notice how the spread (black line) and the S&P 500 (red dashed line) move in sync off of the March low. The magnitude of the daily moves may be different, but their directionality is almost lock step. Now take a look at the upper right corner of the chart. Notice that when the S&P 500 (red dashed line) moved higher on Wednesday and Thursday of last week, the HYG:IEF spread broke down. Not only did the spread head lower, but HYG made the bottom ten performer ETF list on Wednesday and Thursday. That is a serious divergence on two straight up days for the market. I realize that two days does not a trend make, but this is definitely uncharacteristic behavior since the market bottomed in March. This is a situation that bears watching.
© 2024 Benzinga.com. Benzinga does not provide investment advice. All rights reserved.