
The stock market set new highs last week as measures of the economy, like job creation, continued to cool.
Some charts from September's research notes, news articles, and blogs caught my eye. Instead of publishing a series of newsletters, I figured I'd do a lightning round here.
The stock market is not the economy
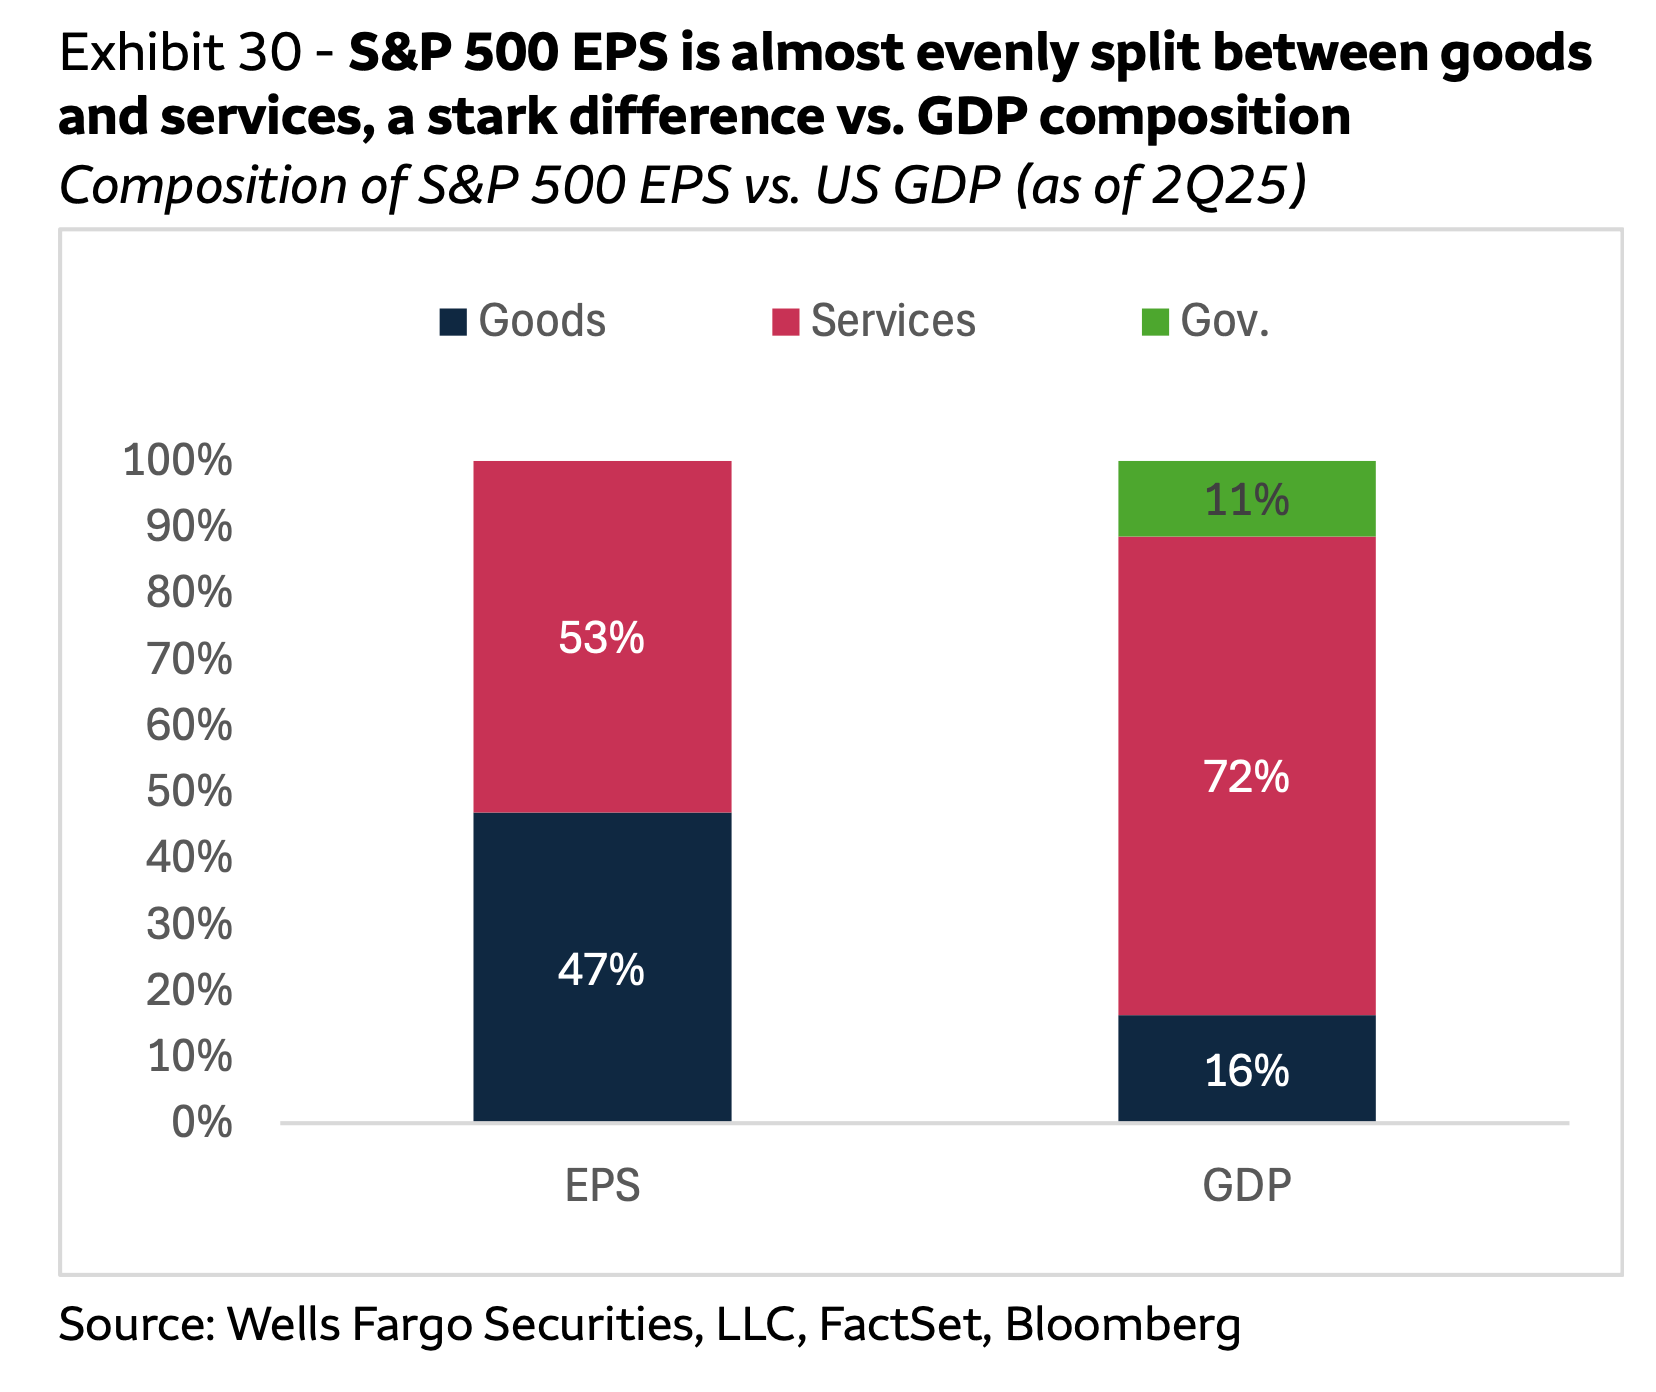
The U.S. stock market and the U.S. economy are closely intertwined. Yet the makeup of earnings per share (EPS), which drives stock prices, differs in several key ways from the makeup of GDP.
From Wells Fargo's Ohsung Kwon: "Although EPS has been decently correlated to GDP (52% correlation since 1948), there is a key difference in the composition of S&P 500 EPS and GDP. The U.S. economy is predominantly services-oriented, representing over 70% of GDP, but S&P 500 earnings are almost evenly split between services and goods/manufacturing."
For more on how the stock market and the economy differ, read: The stock market and the economy are diverging 📊
The U.S. stock market is massive
The world's stock markets are often ranked based on performance. So, it can be easy to forget that the U.S. stock market eclipses the rest of the world.
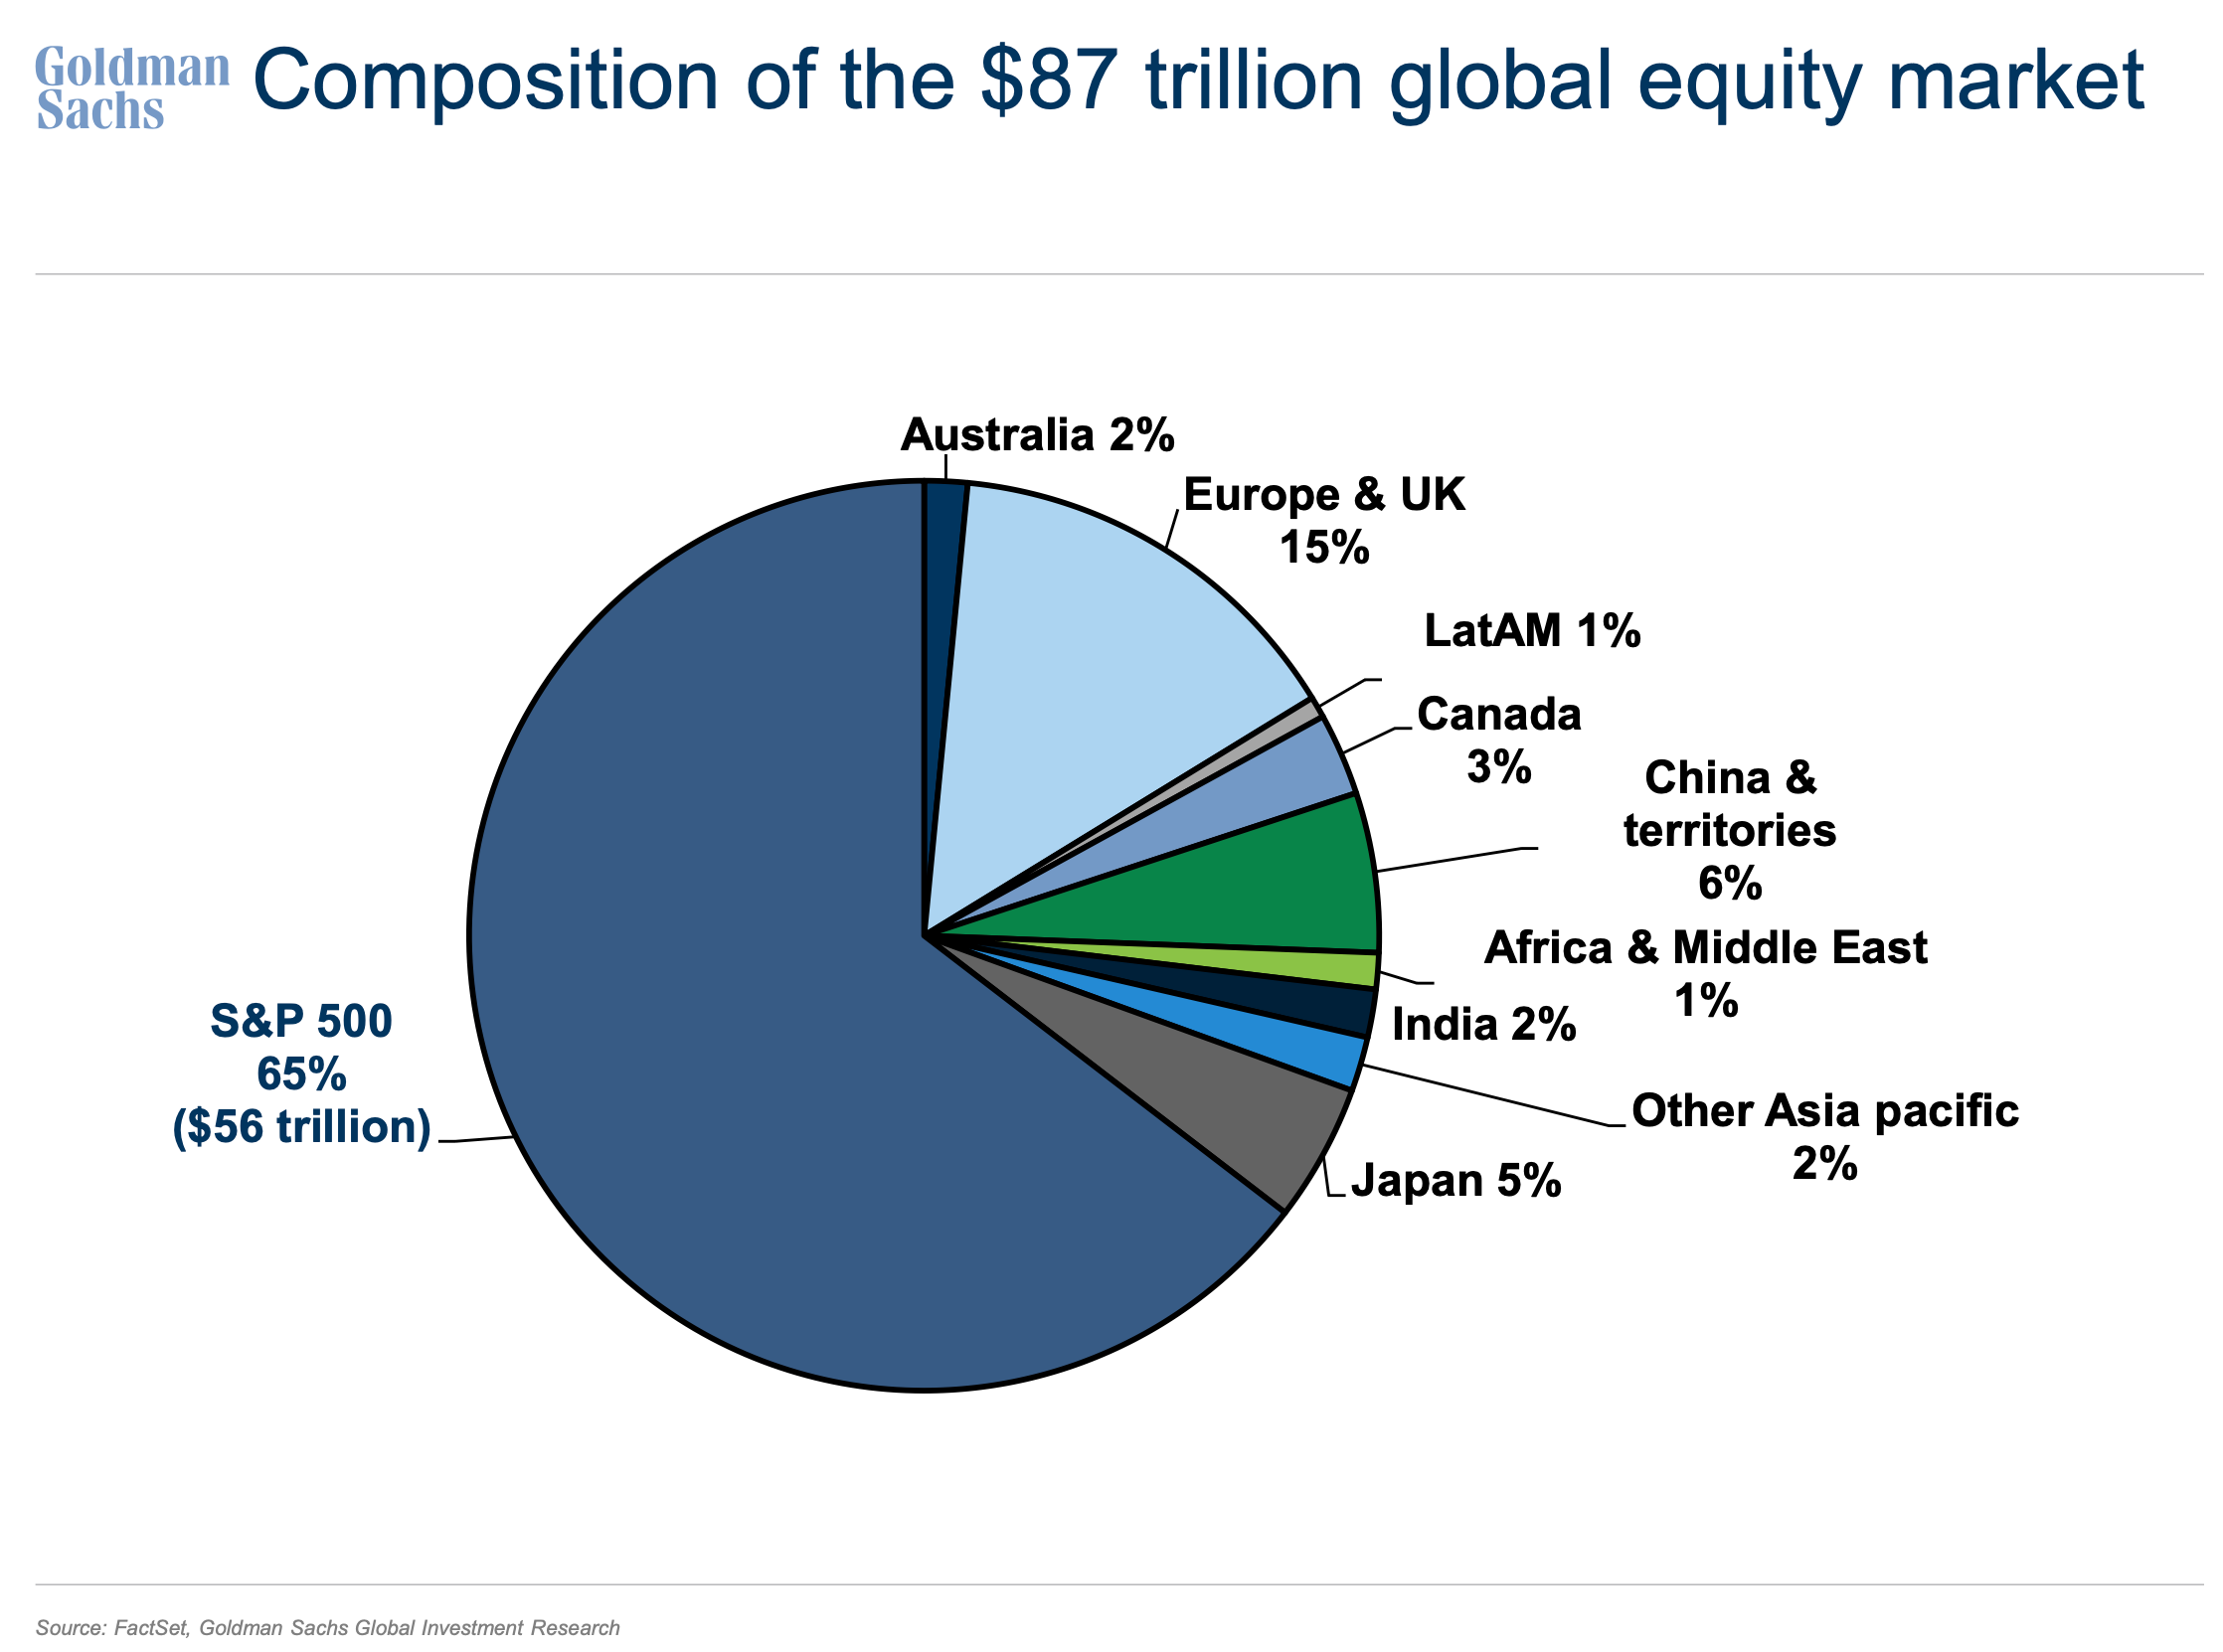
It's worth mentioning that the S&P 500 accounts for 80% of the value of all U.S. stocks. So, the S&P is effectively the U.S. stock market.
For more on the U.S. stock market and the global stage, read: Where in the world do S&P 500 companies do business? 🗺️
U.S. earnings growth prospects are strong relative to the world
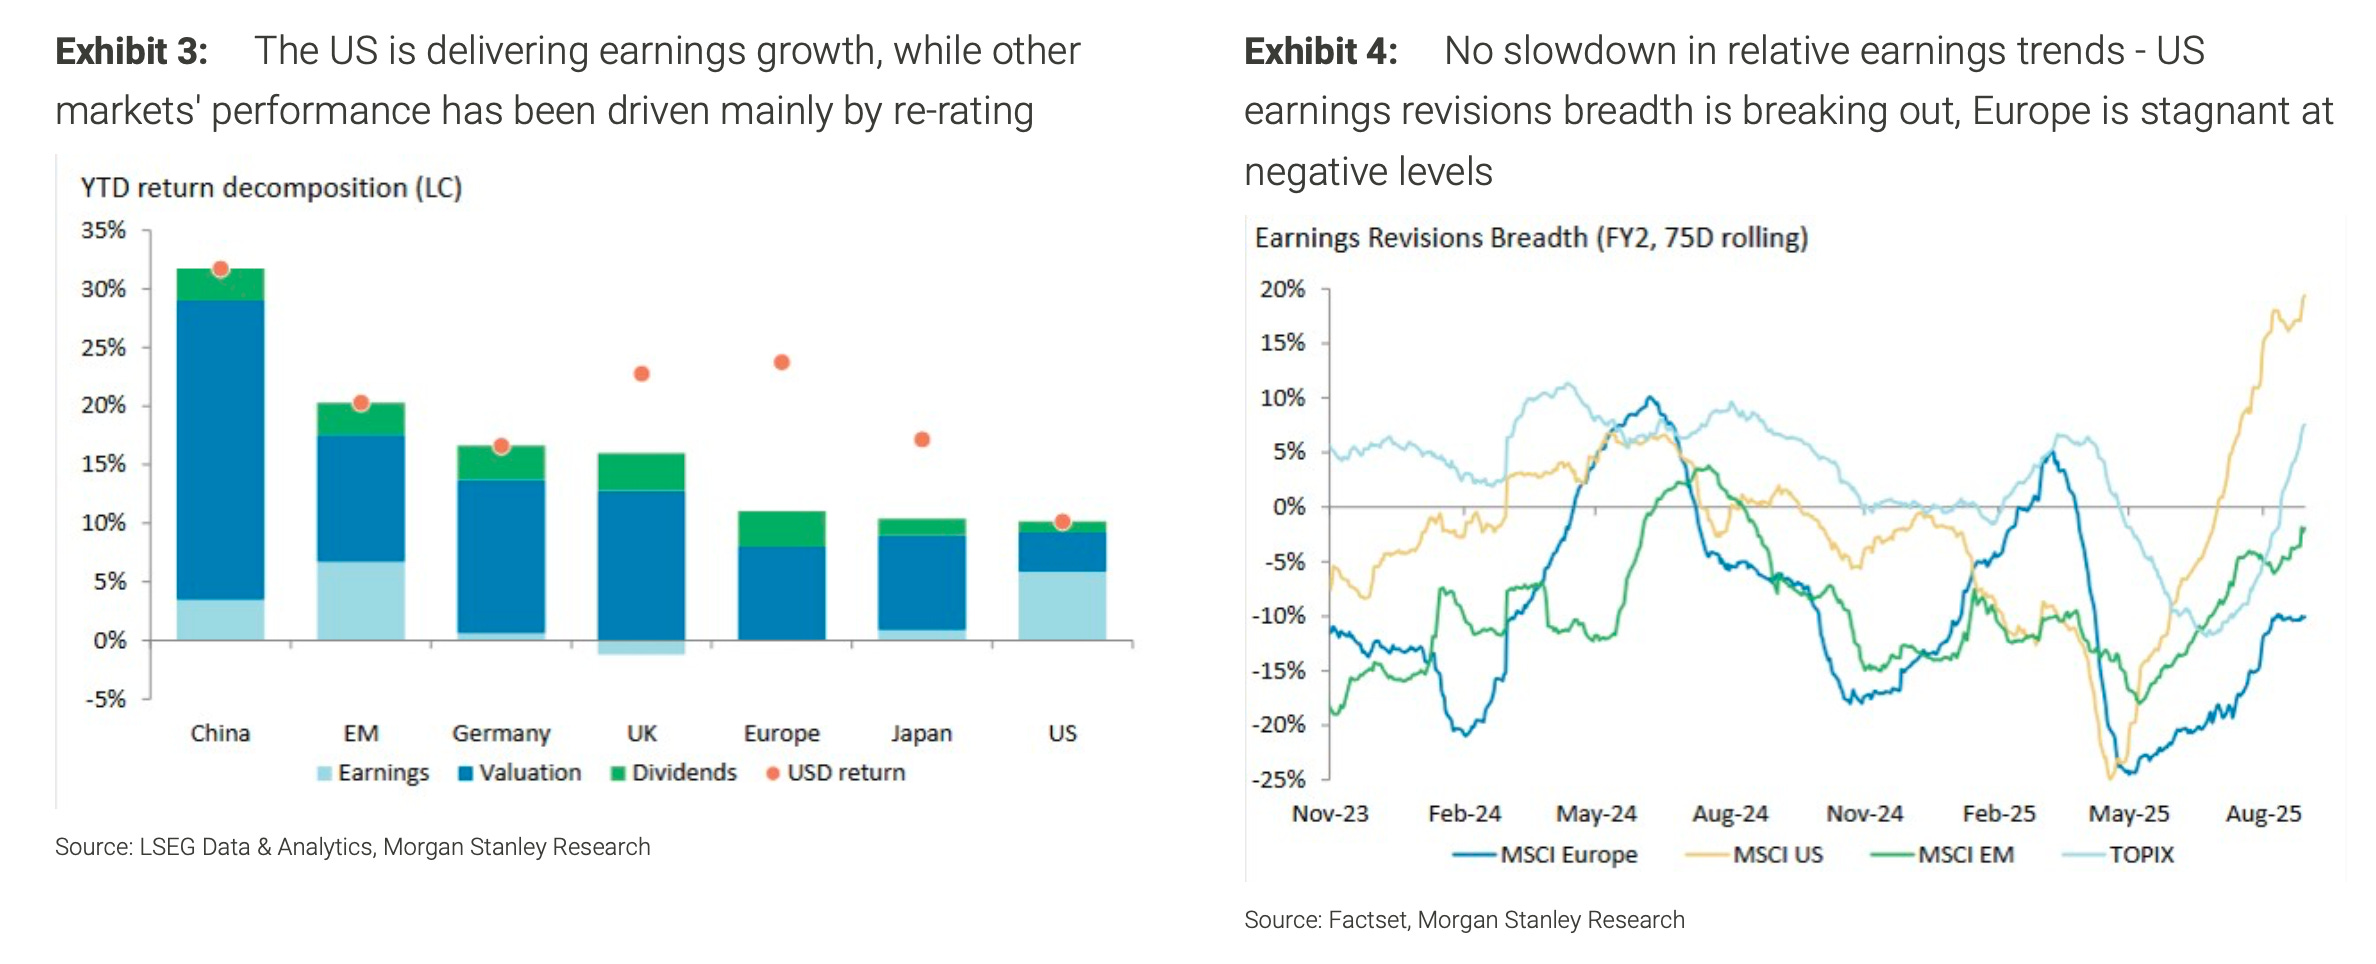
One of the main reasons the U.S. stock market has grown so large is that U.S. companies have exhibited the best earnings growth for years. Some analysts expect this trend to continue.
From Morgan Stanley's Katy Huberty: "U.S. Earnings Trends Continue to Lead Global Markets … Although YTD returns for U.S. stocks have lagged globally, U.S. stocks' returns have been driven mostly by earnings growth, whereas earnings in Europe have been basically flat — European equities' performance has been driven by multiple expansion and dividends. Looking forward, while earnings revisions breadth has turned up for all regions, the U.S. revisions uptrend is by far the strongest."
For more on the outlook for U.S. stocks in the global market, read: Why I’m not losing sleep as the U.S. stock market underperforms the rest of the world 🌎
S&P 500 earnings usually go up 📈
The U.S. stock market has been going up for a very long time. Why?
Because earnings have been going up for a very long time, and earnings are the most important driver of stock prices.
Just take a look at this 90-year chart of S&P 500 earnings per share from Deutsche Bank's Binky Chadha:
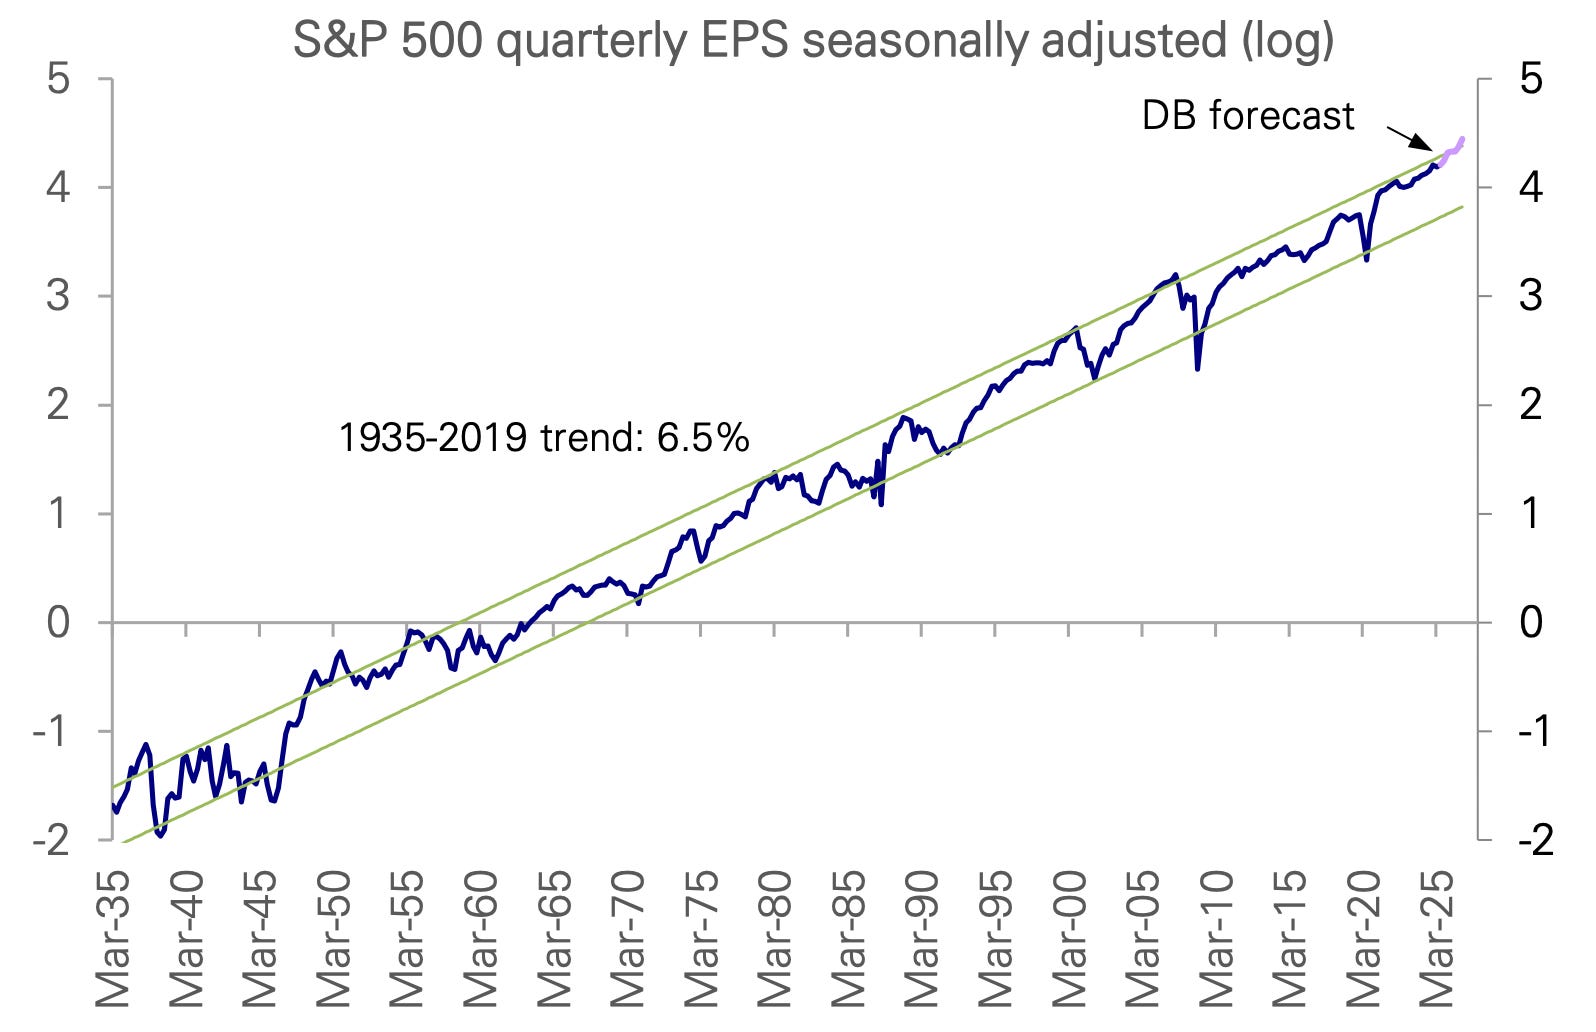
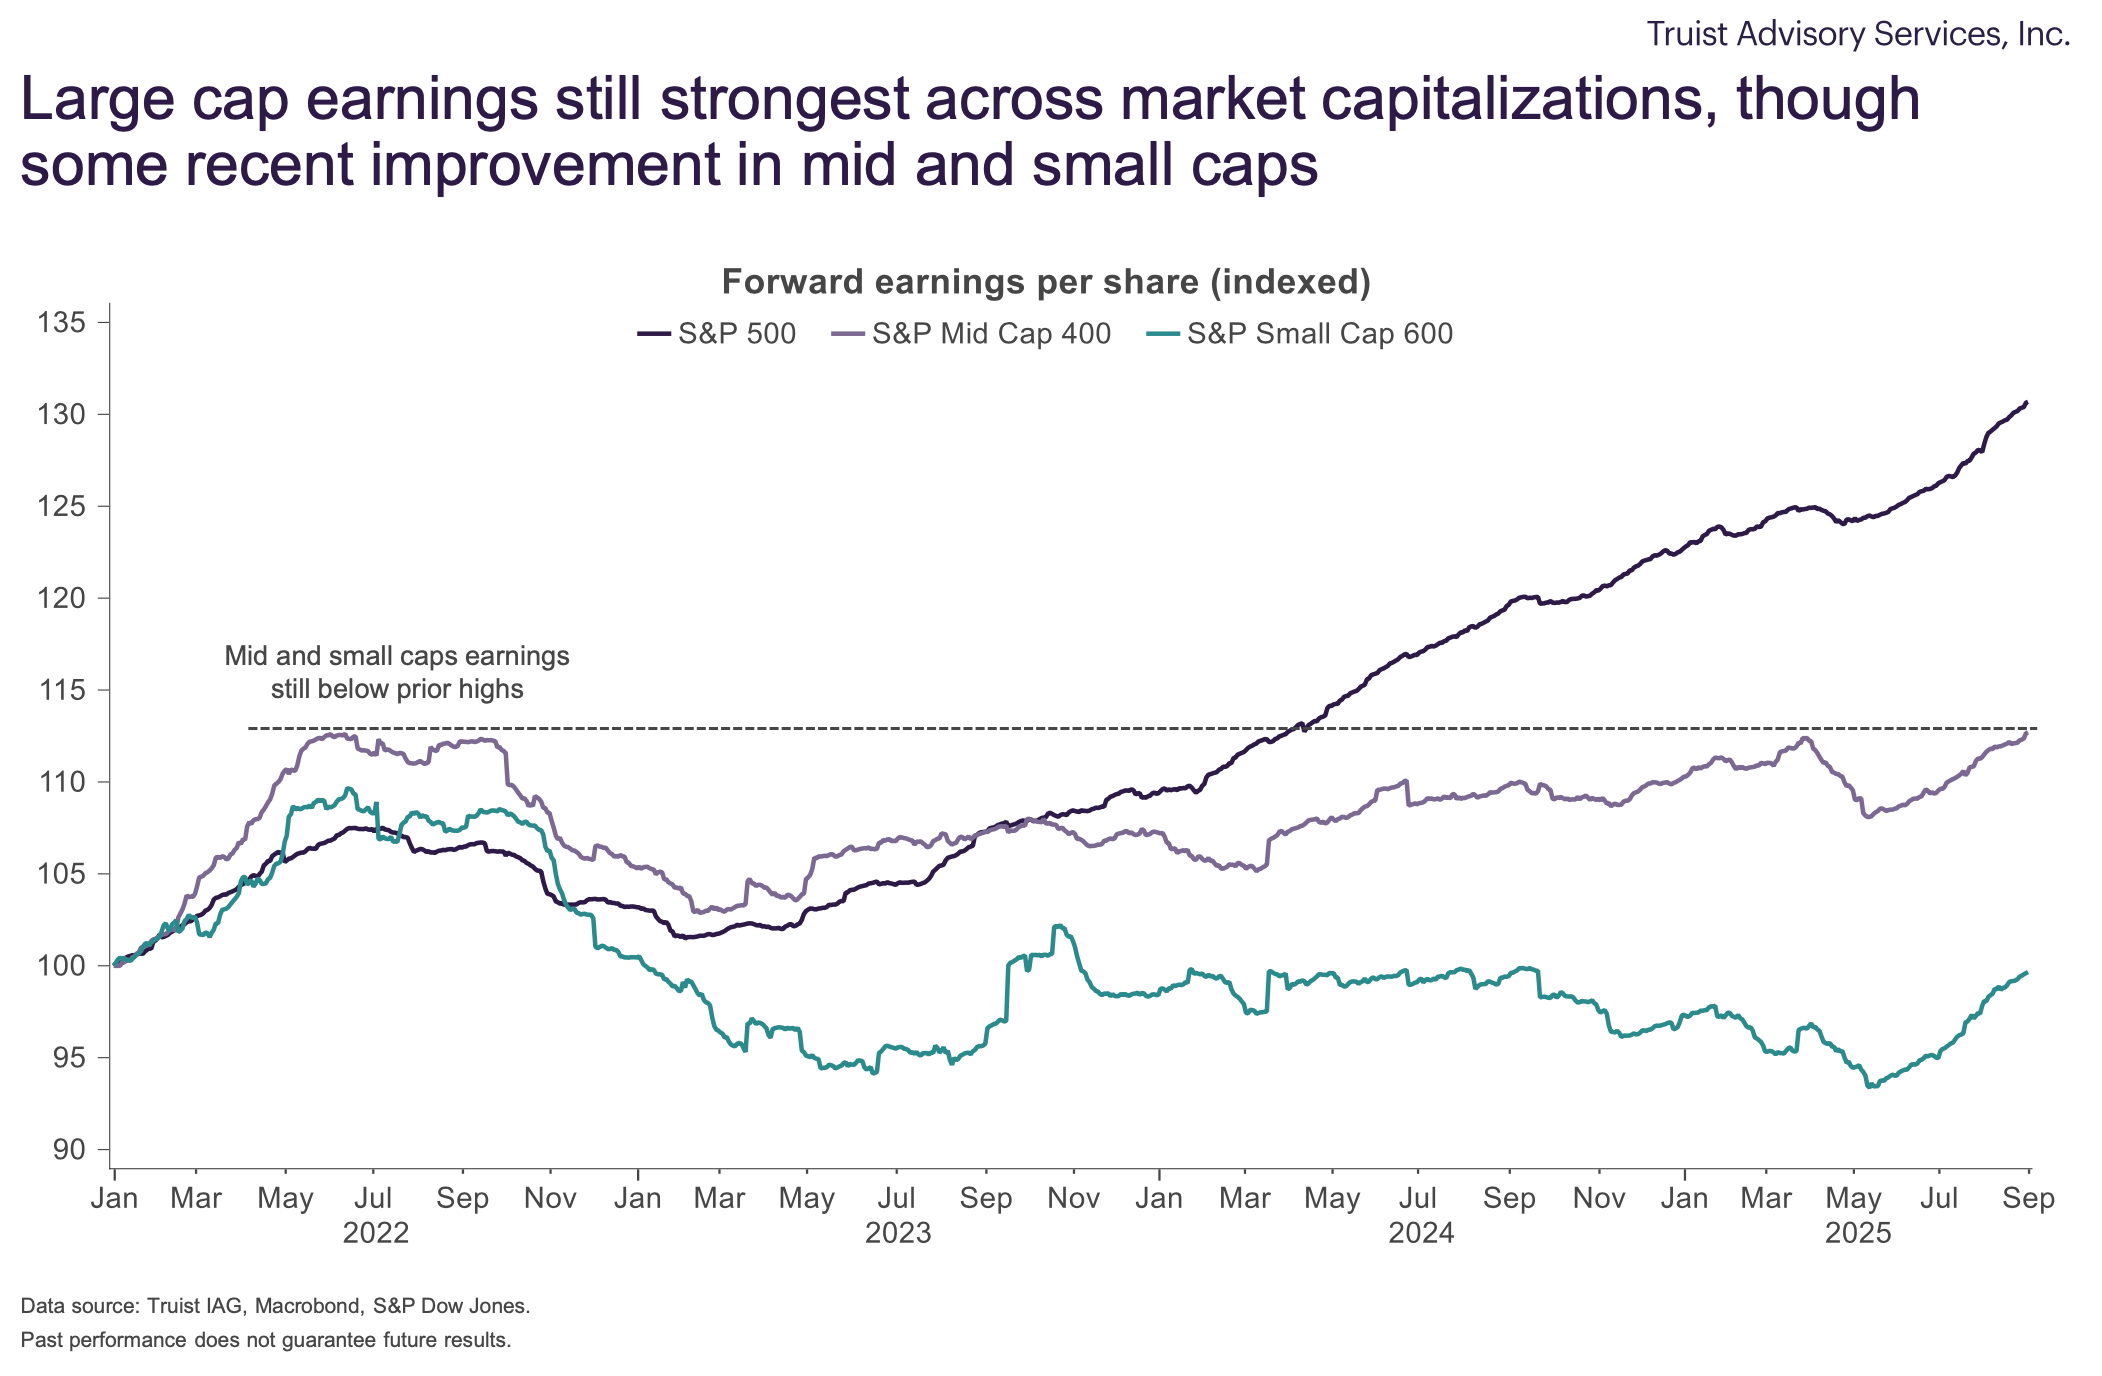
It's worth mentioning that the earnings growth prospects for the large-cap companies in the S&P 500 are more favorable than those of small- and mid-cap companies.
For more, read: A very long-term chart of U.S. stock prices usually going up 📈 and Earnings are the most important driver of stock prices💰
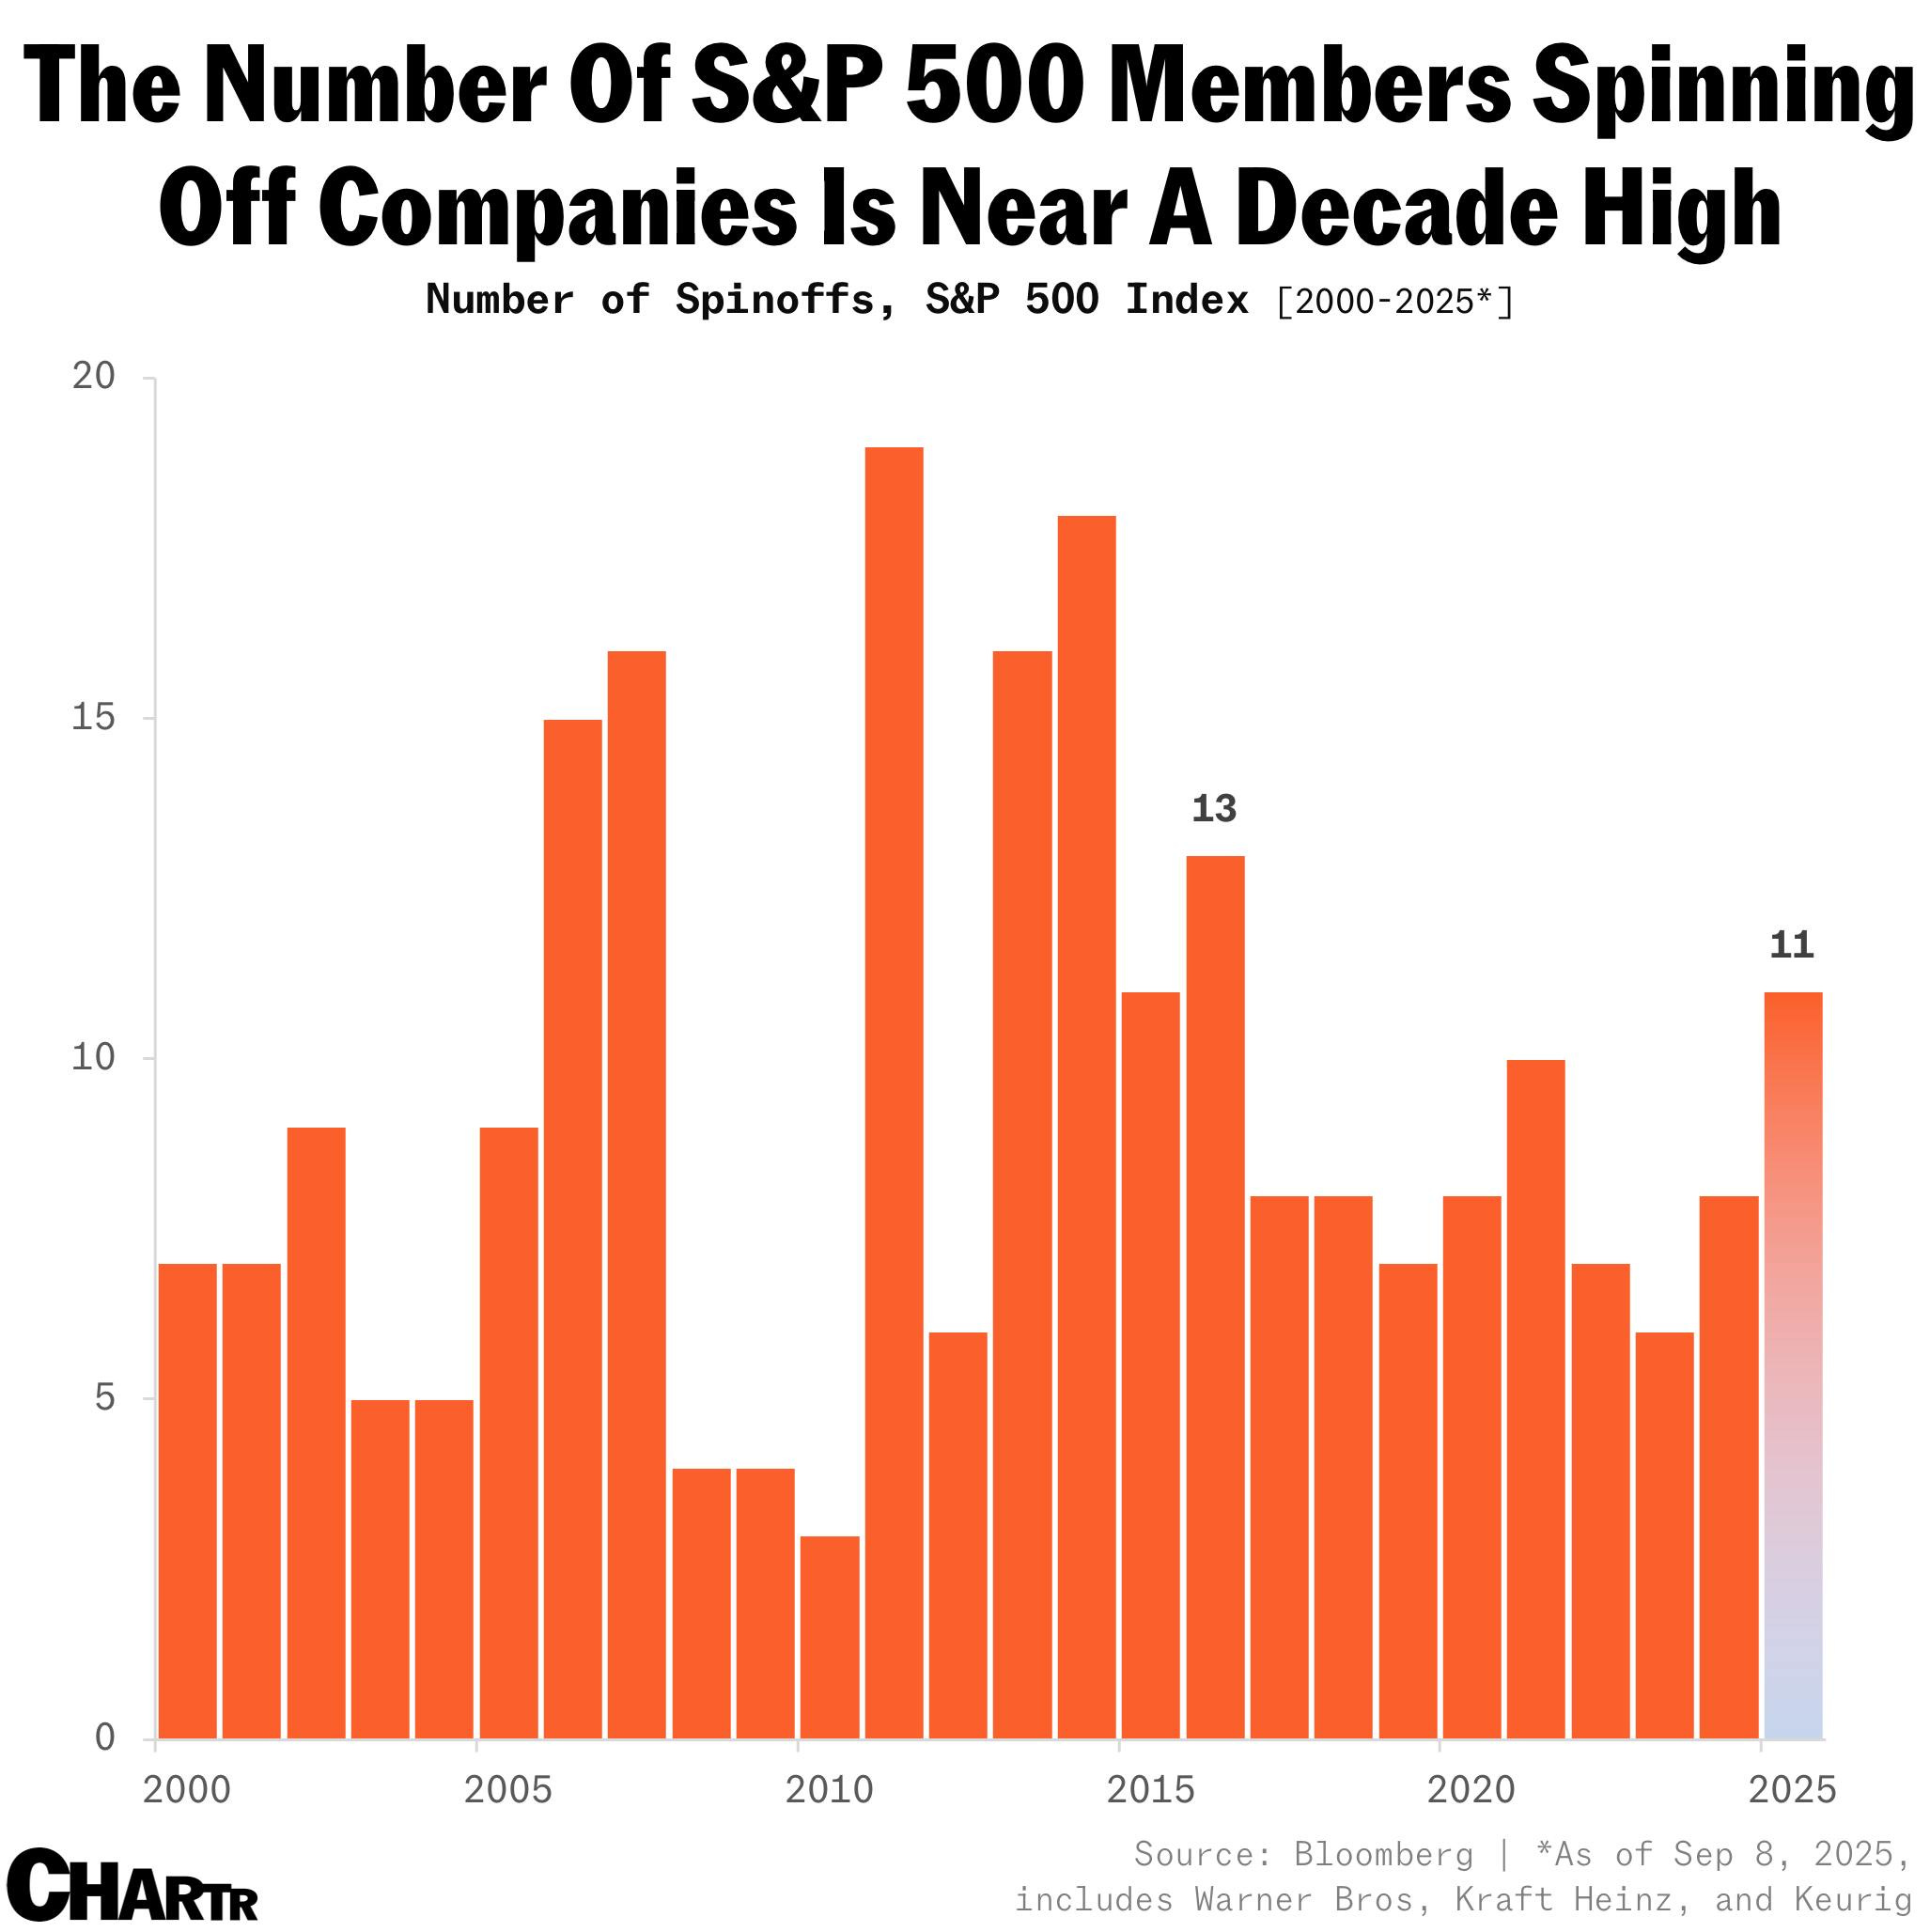
A lot of companies are breaking up 💔
Here's Sherwood News' Hyunsoo Rim: "Amid shareholders' growing push for simplification, spinoffs have been growing in the US. As of early September, there have been 11 announced spin-offs from S&P 500 companies — the most since 2016."
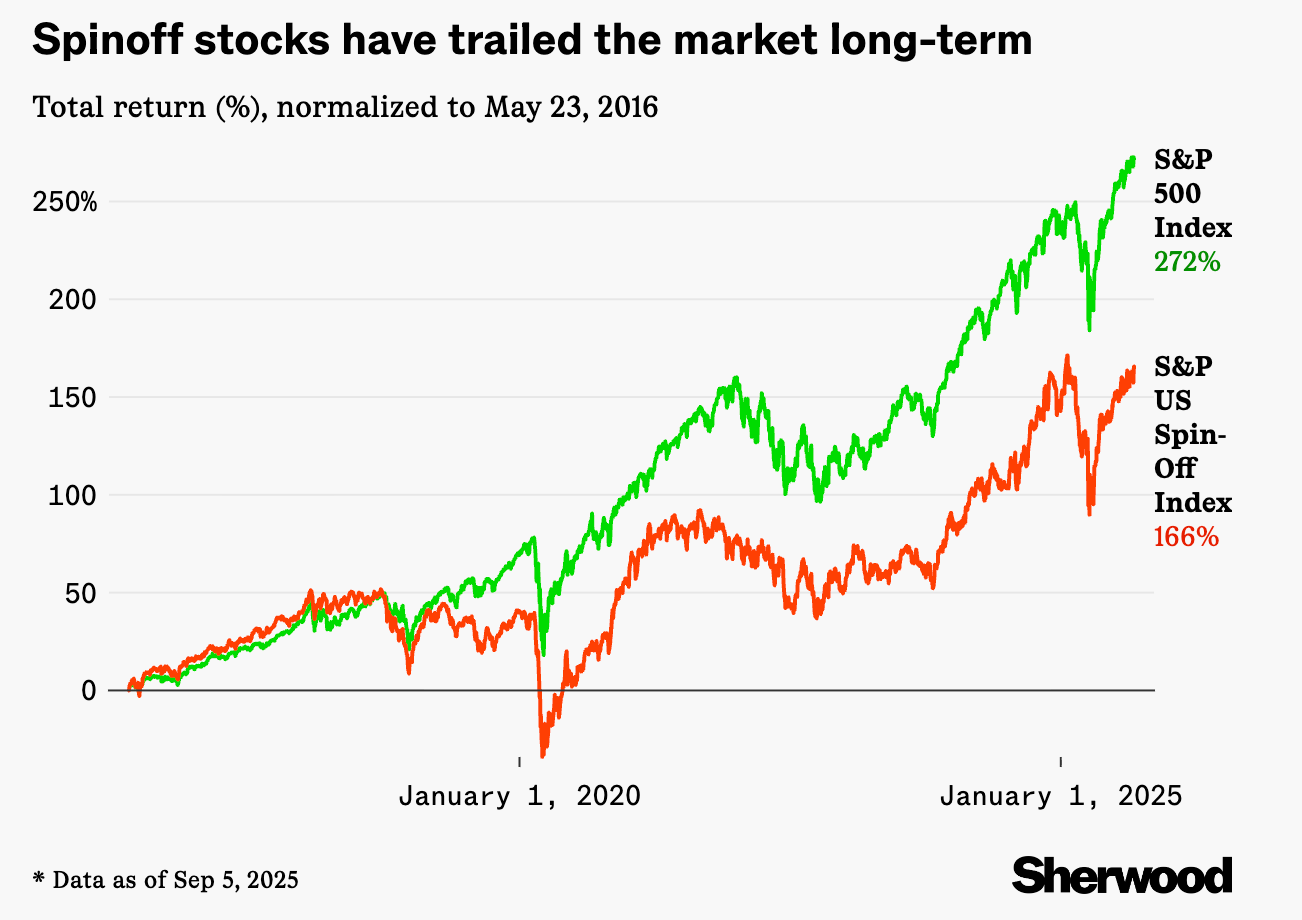
Stock price performance following a spin-off is mixed. From Rim: "But whether these corporate divorces actually pay off is another story. In the first 18-24 months following the split, companies spun off do tend to outperform the S&P 500 by ~10%, according to Trivariate Research — but those early gains might not hold up over longer horizons. … Since its 2015 launch, the S&P US Spin-Off Index — which tracks $1 billion+ S&P 500 companies spun off in the last four years — has lagged behind the main S&P 500 Index."
For more on the M&A side of things, read: How the S&P 500 quietly becomes bigger than 500 companies 🤝
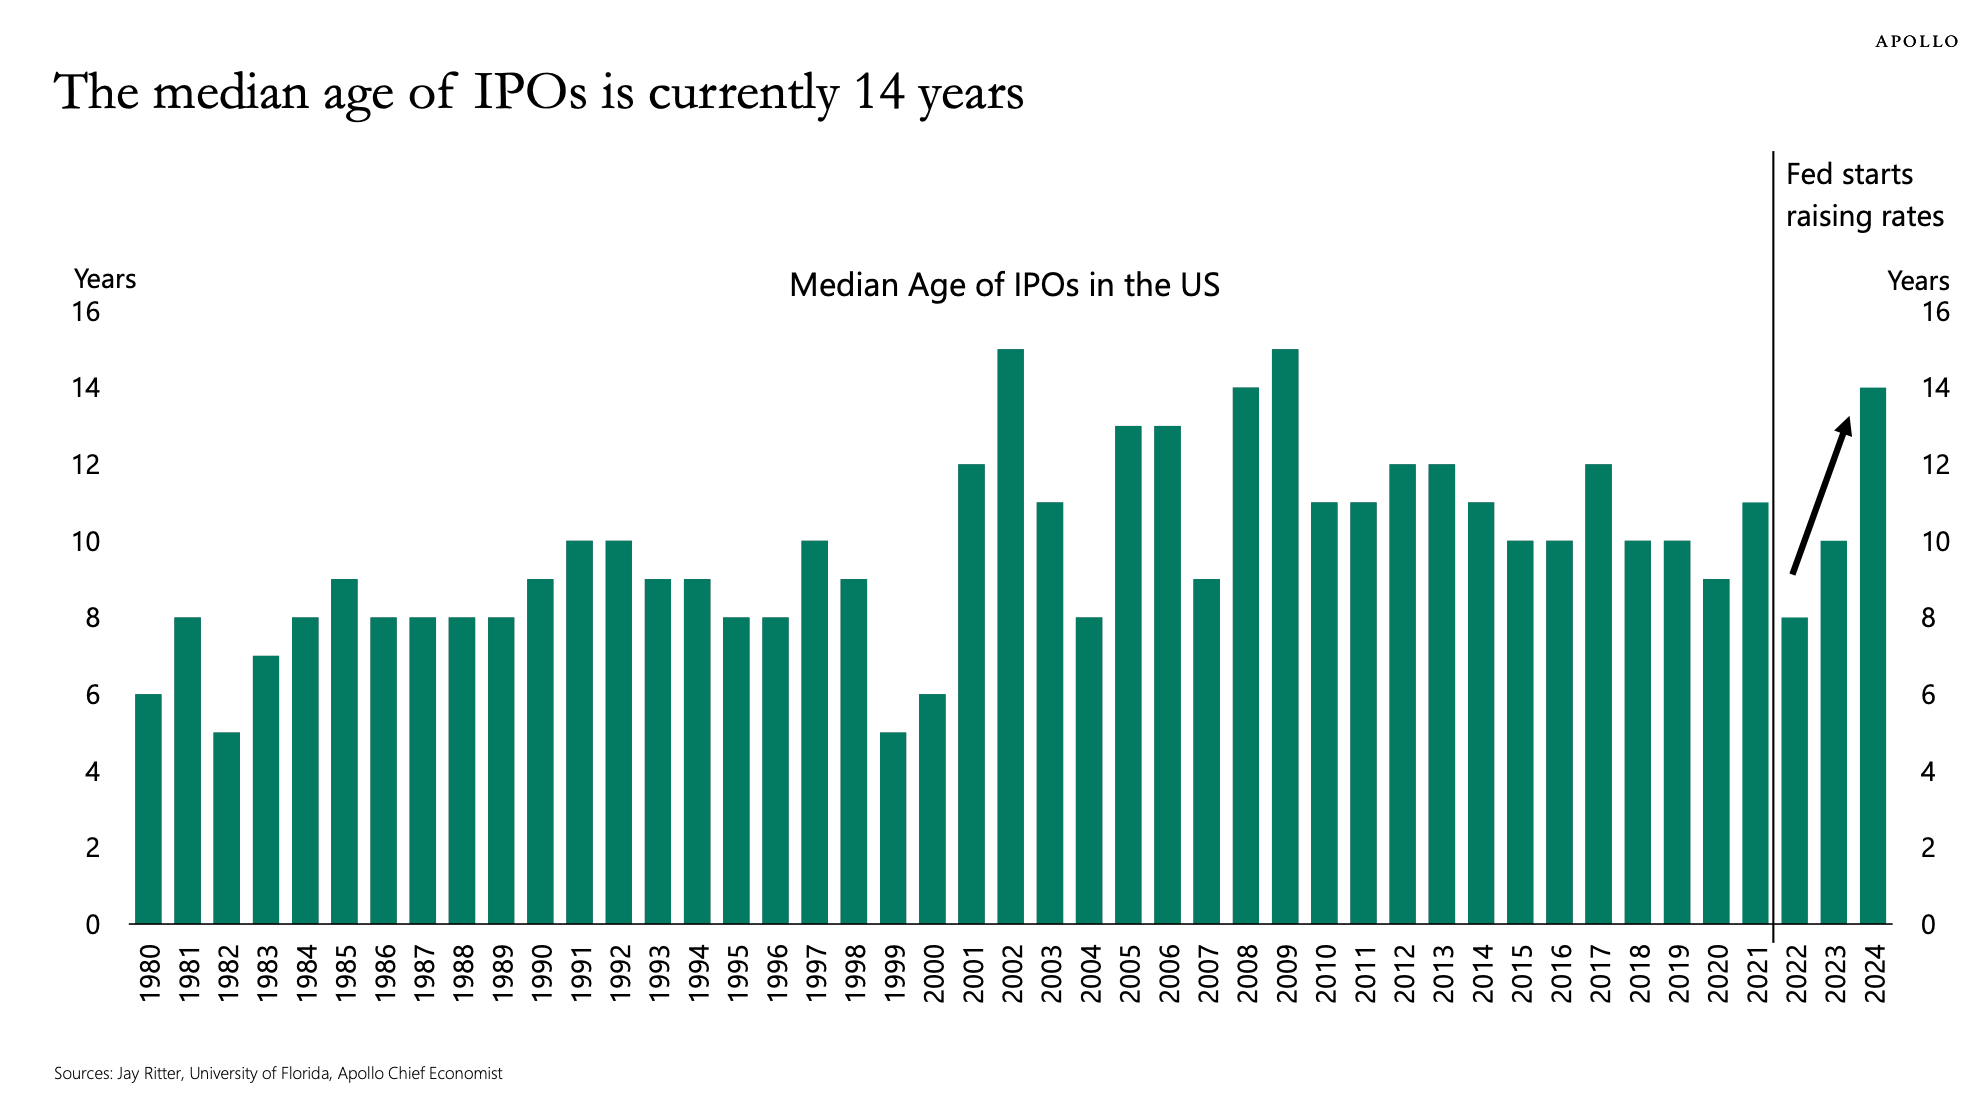
Companies are waiting longer before going public 👴🏼
From Apollo's Torsten Slok: "There are fewer public companies to invest in, and firms that decide to do an IPO are getting older and older. In 1999, the median age of IPOs was five years. In 2022, it was eight years, and today, the median age of IPOs has increased to 14 years. … The rise in the age of companies going public is not only a result of the Fed raising interest rates in 2022, but also the consequence of more companies wanting to stay private for longer to avoid the burdens of being public."
Continuing on Slok's discussion of scarcity in publicly traded companies, S&P 500 companies continue to buy back far more shares than they issue.
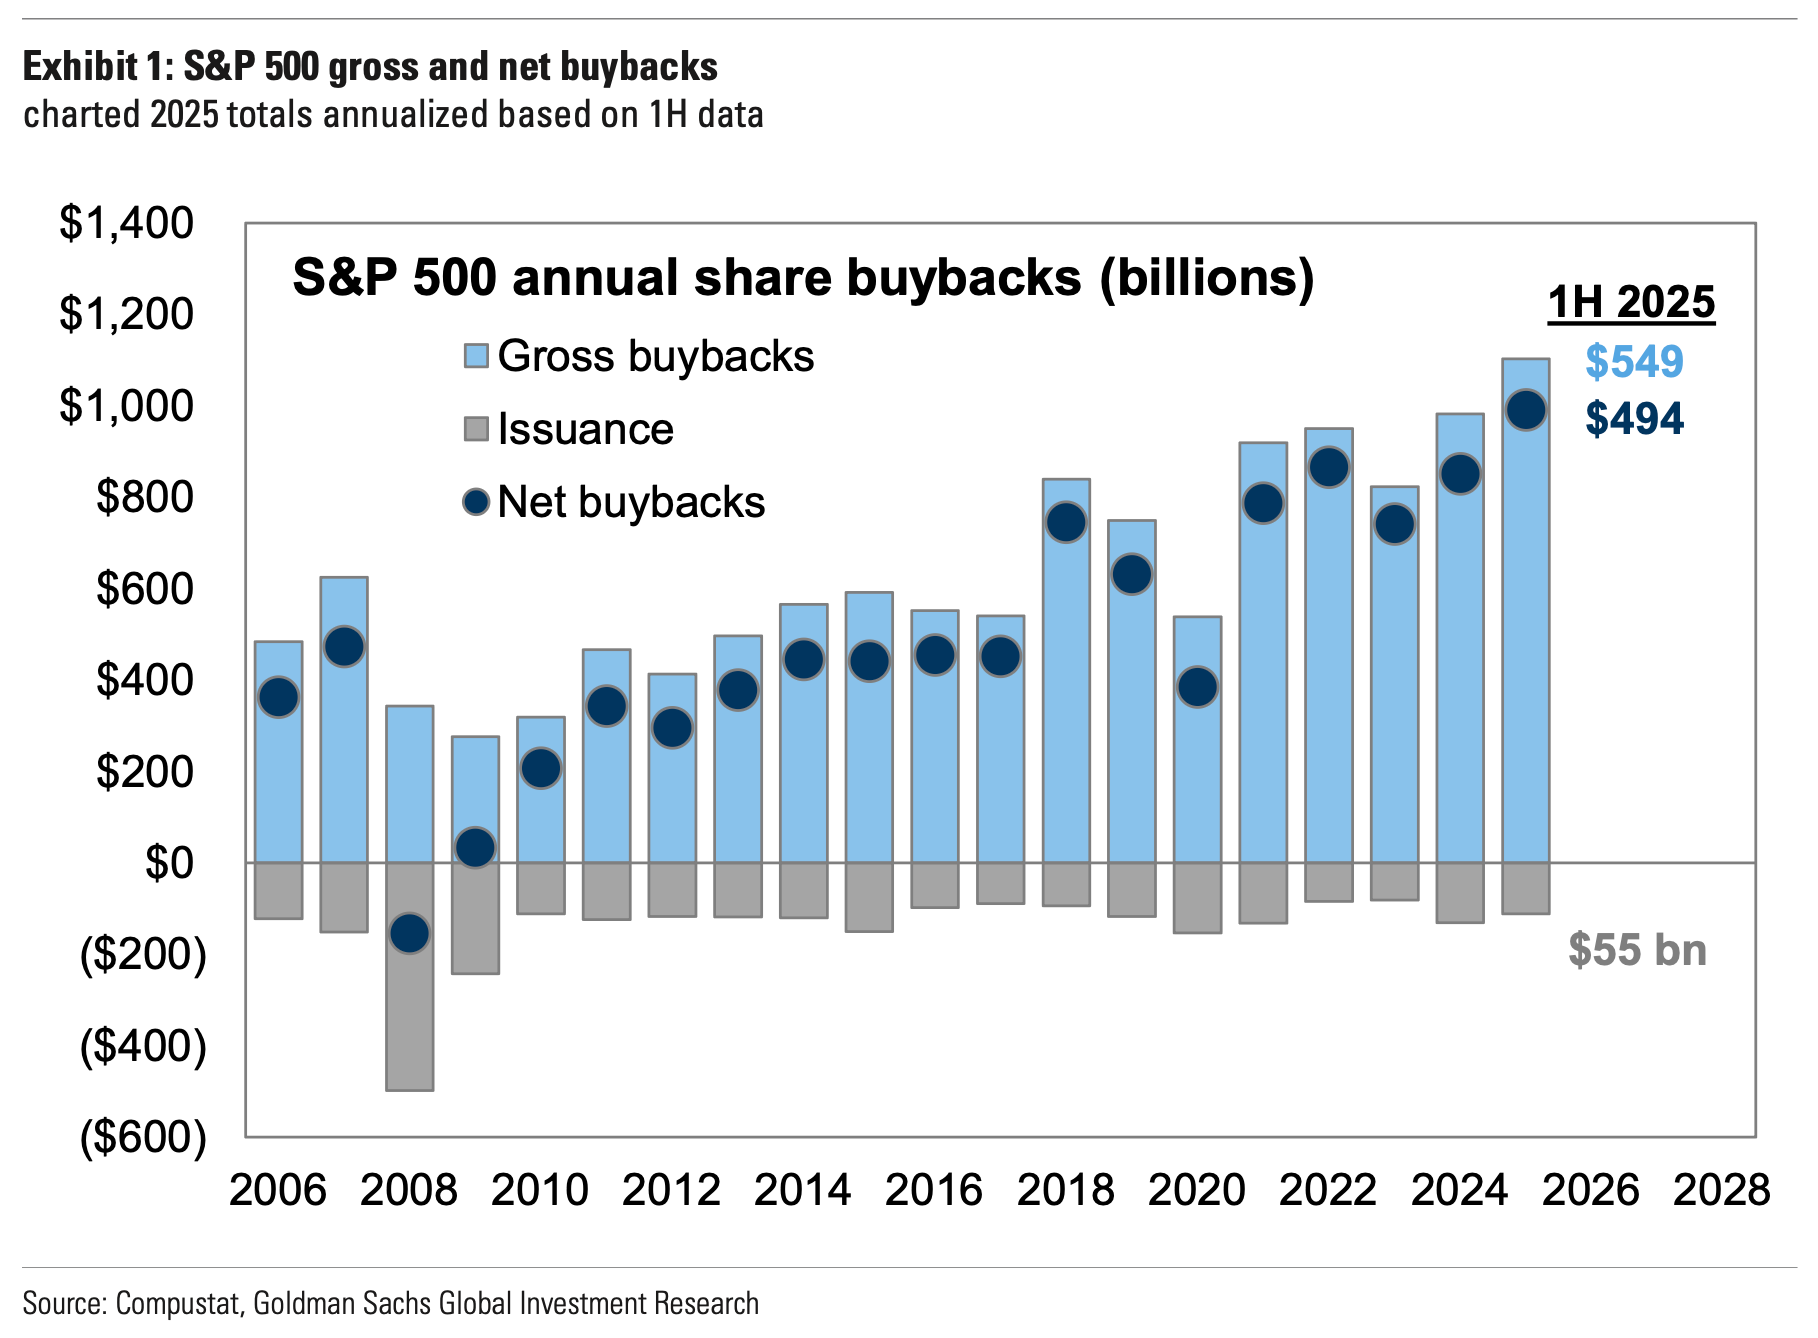
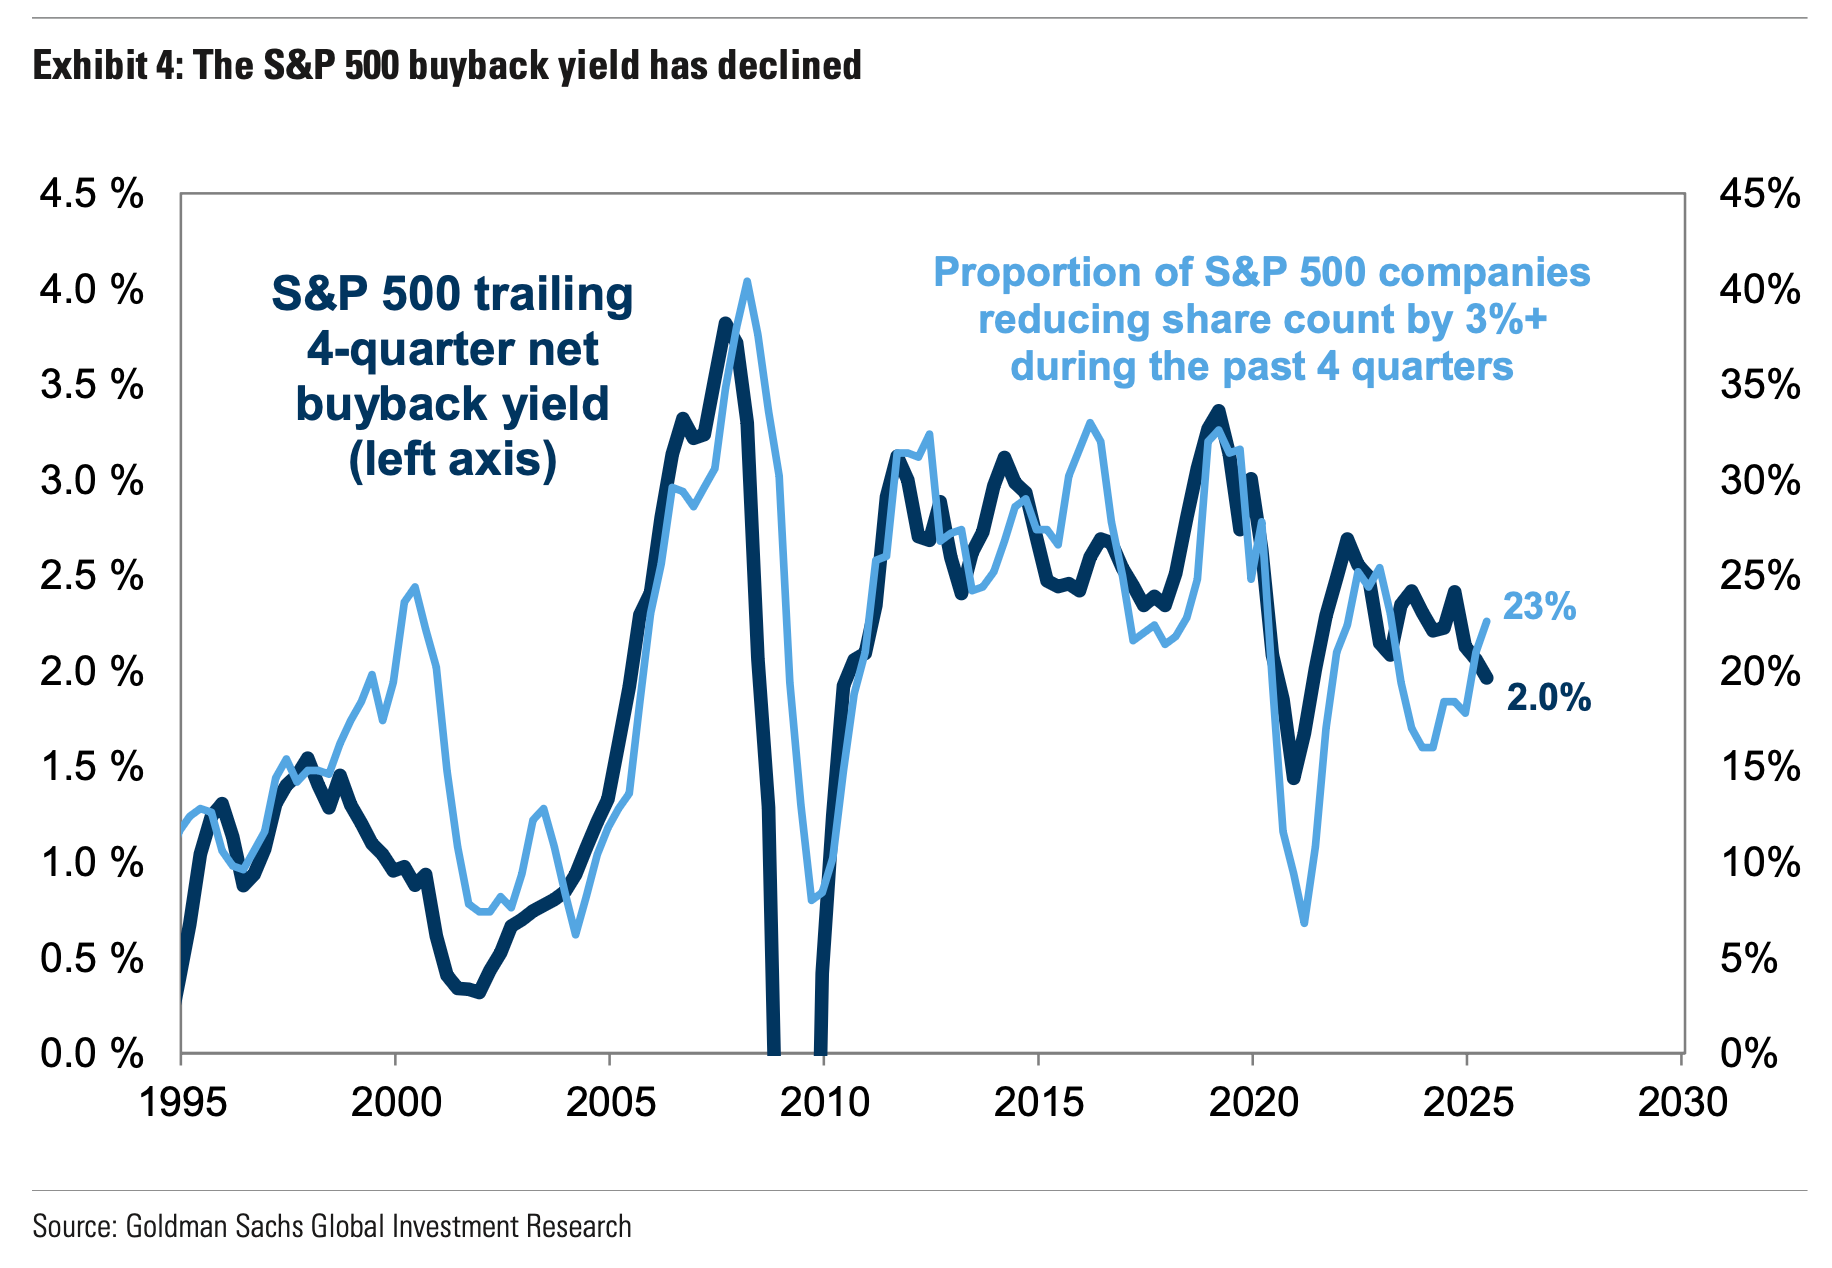
But the pace of net buybacks has lagged the performance of the stock market. This trend is reflected by the declining net buyback yield.
For more discussion on buybacks, read: The truth about the hundreds of billions of dollars worth of stock buybacks 💸
Margin debt is up… but not really 🤔
Debt balances in margin accounts climbed above $1 trillion in June, setting off alarms for some.
Margin debt is a great example of a variable that needs a little more context. Ritholtz Wealth Management's Matt Cerminaro charted margin debt as a percentage of S&P 500 market cap. He found that margin debt is arguably very low.
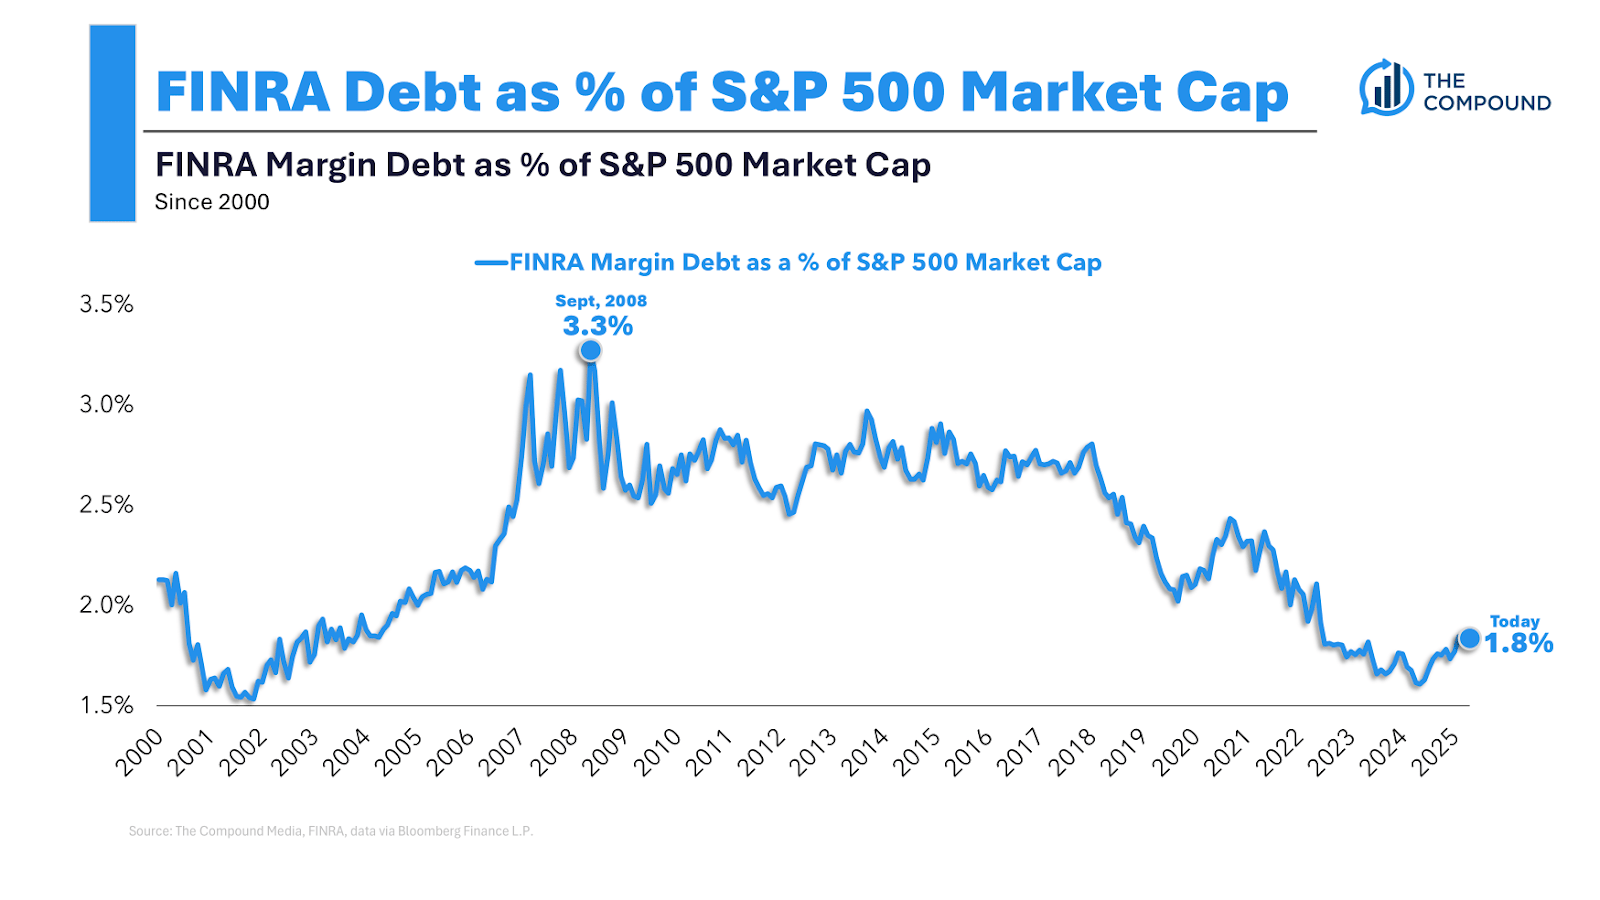
Ritholtz Wealth's Callie Cox offered more color: "Also, investors don't really borrow money from brokerages anymore. That's very early 2000s, like low-rise jeans and tracksuits (although both are coming back in style, so…). They employ the same trades, but through more sophisticated products like options or leveraged exchange-traded funds (you know, those wild 3x short Tesla funds you hear about). Everyday investors haven't had access to these tools for very long, and they've really leaned into non-margin leveraged trades since the early COVID days. A lot of speculation is happening outside of what margin debt is showing."
For more on margin debt, read: Remember when people were worried about margin debt? 😬
Tariff chatter is on the rise — get ready for tariff-related inflation 🎈
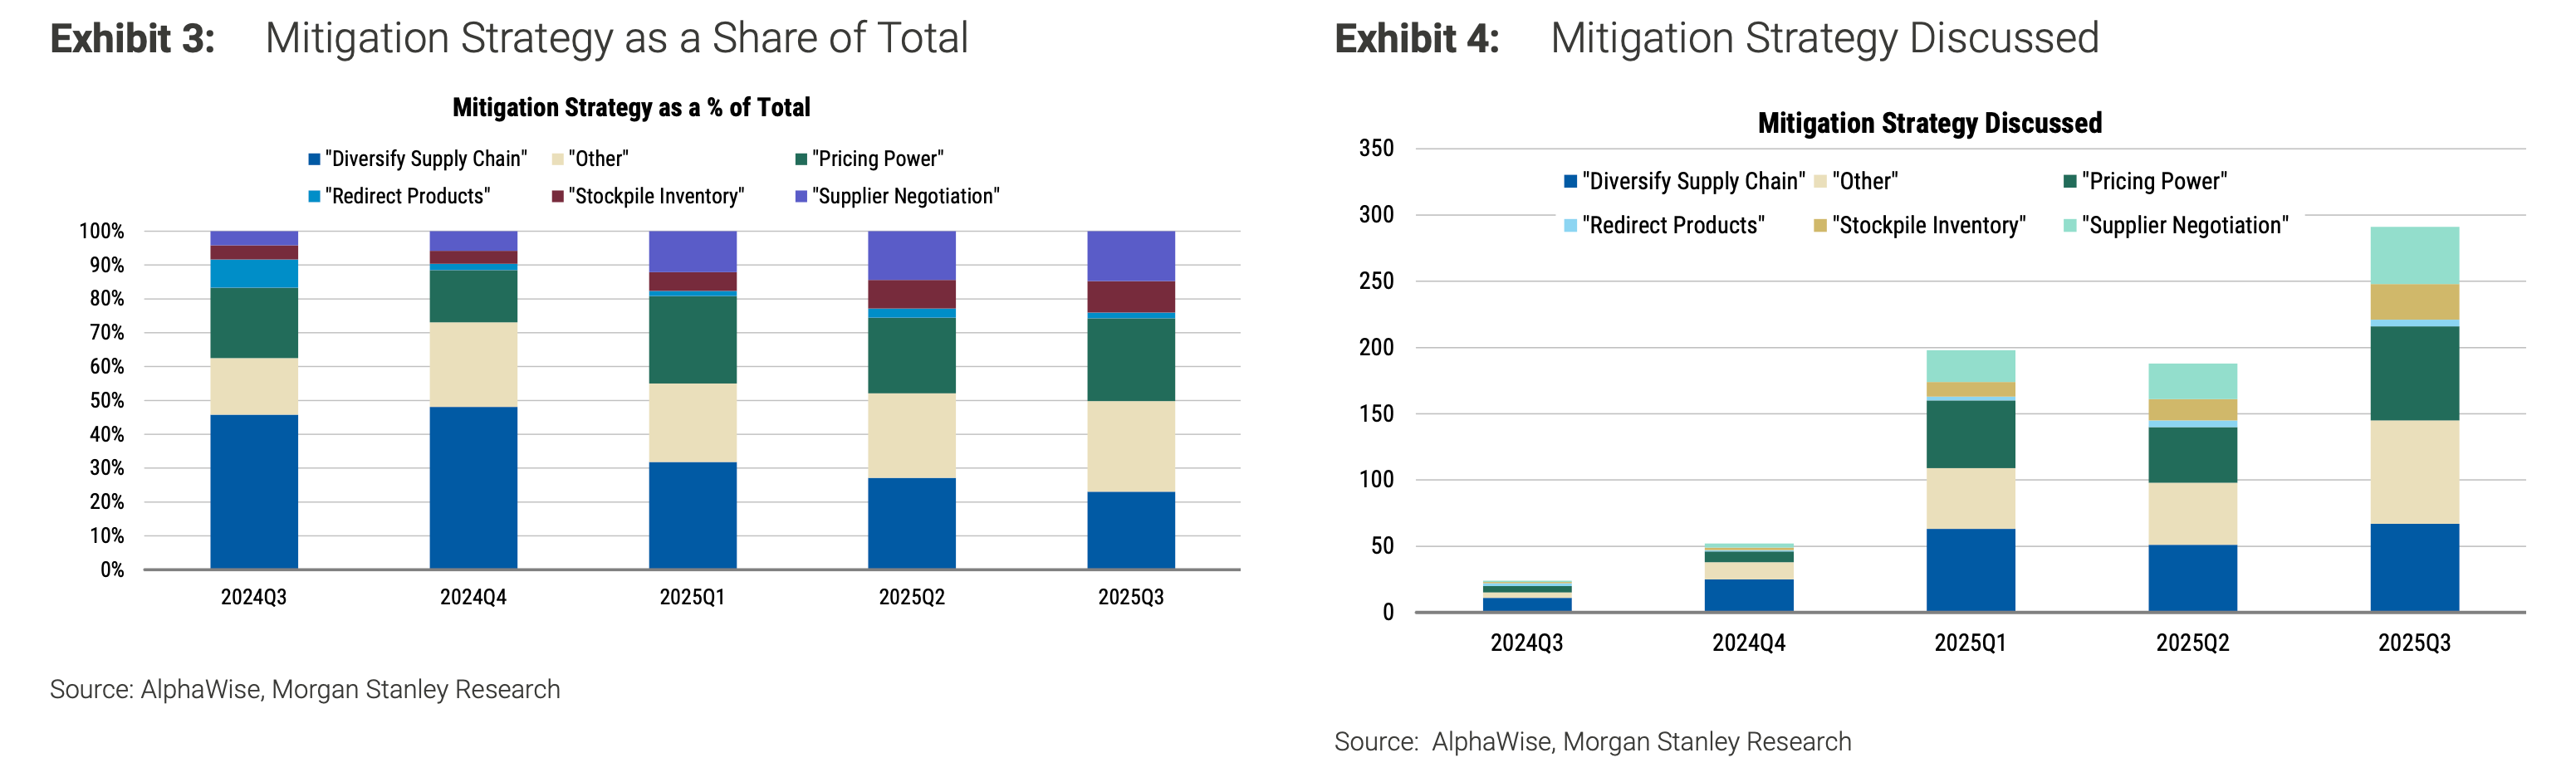
Morgan Stanley analysts reviewed Q2 earnings announcements and calls to look for discussion on how companies plan to address tariffs.
From the report (emphasis added): "Unsurprisingly, we saw a significant increase in the number of mentions of tariff mitigation strategies last quarter with many companies citing multiple strategies. … Pricing power overtook supply chain diversification as the most frequently mentioned mitigation strategy. Across all industries, mentions of supply chain diversification relative to other mitigation strategies appear to be declining, which in our view reflects the notion that supply chain diversification is costly, time-consuming, and a longer-term solution."
For more on how companies are addressing tariffs, read: Wall Street’s view on tariffs summed up in two lengthy sentences 📝 and Companies plan to ‘pass on costs’ to customers 🤑
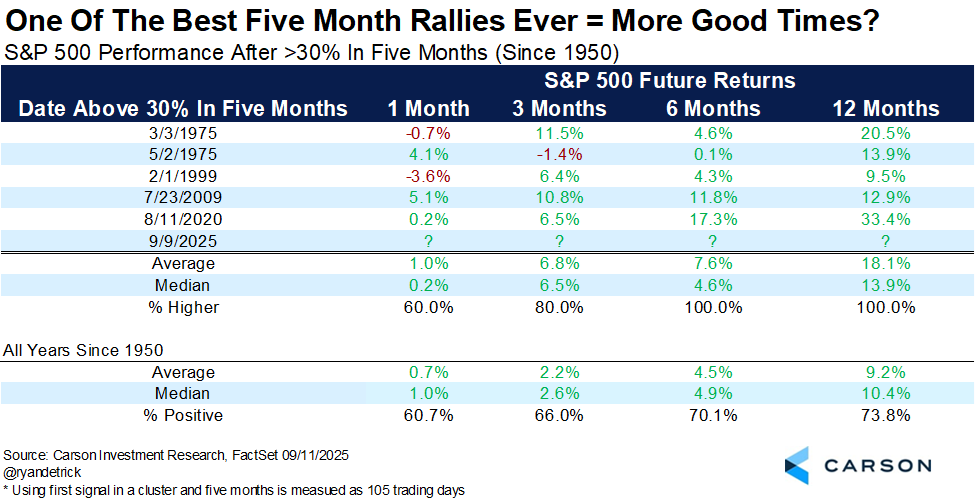
Big rallies are followed by further gains 🚀
The stock market has been on a tear since April. Are we due for a pullback?
From Carson Group's Ryan Detrick: "The S&P 500 just completed one of the best five month rallies ever, up more than 30%. Since 1950, this only happened five other times, but the returns going out a year were much better than average. A year later? Never lower and up more than 18% on average."
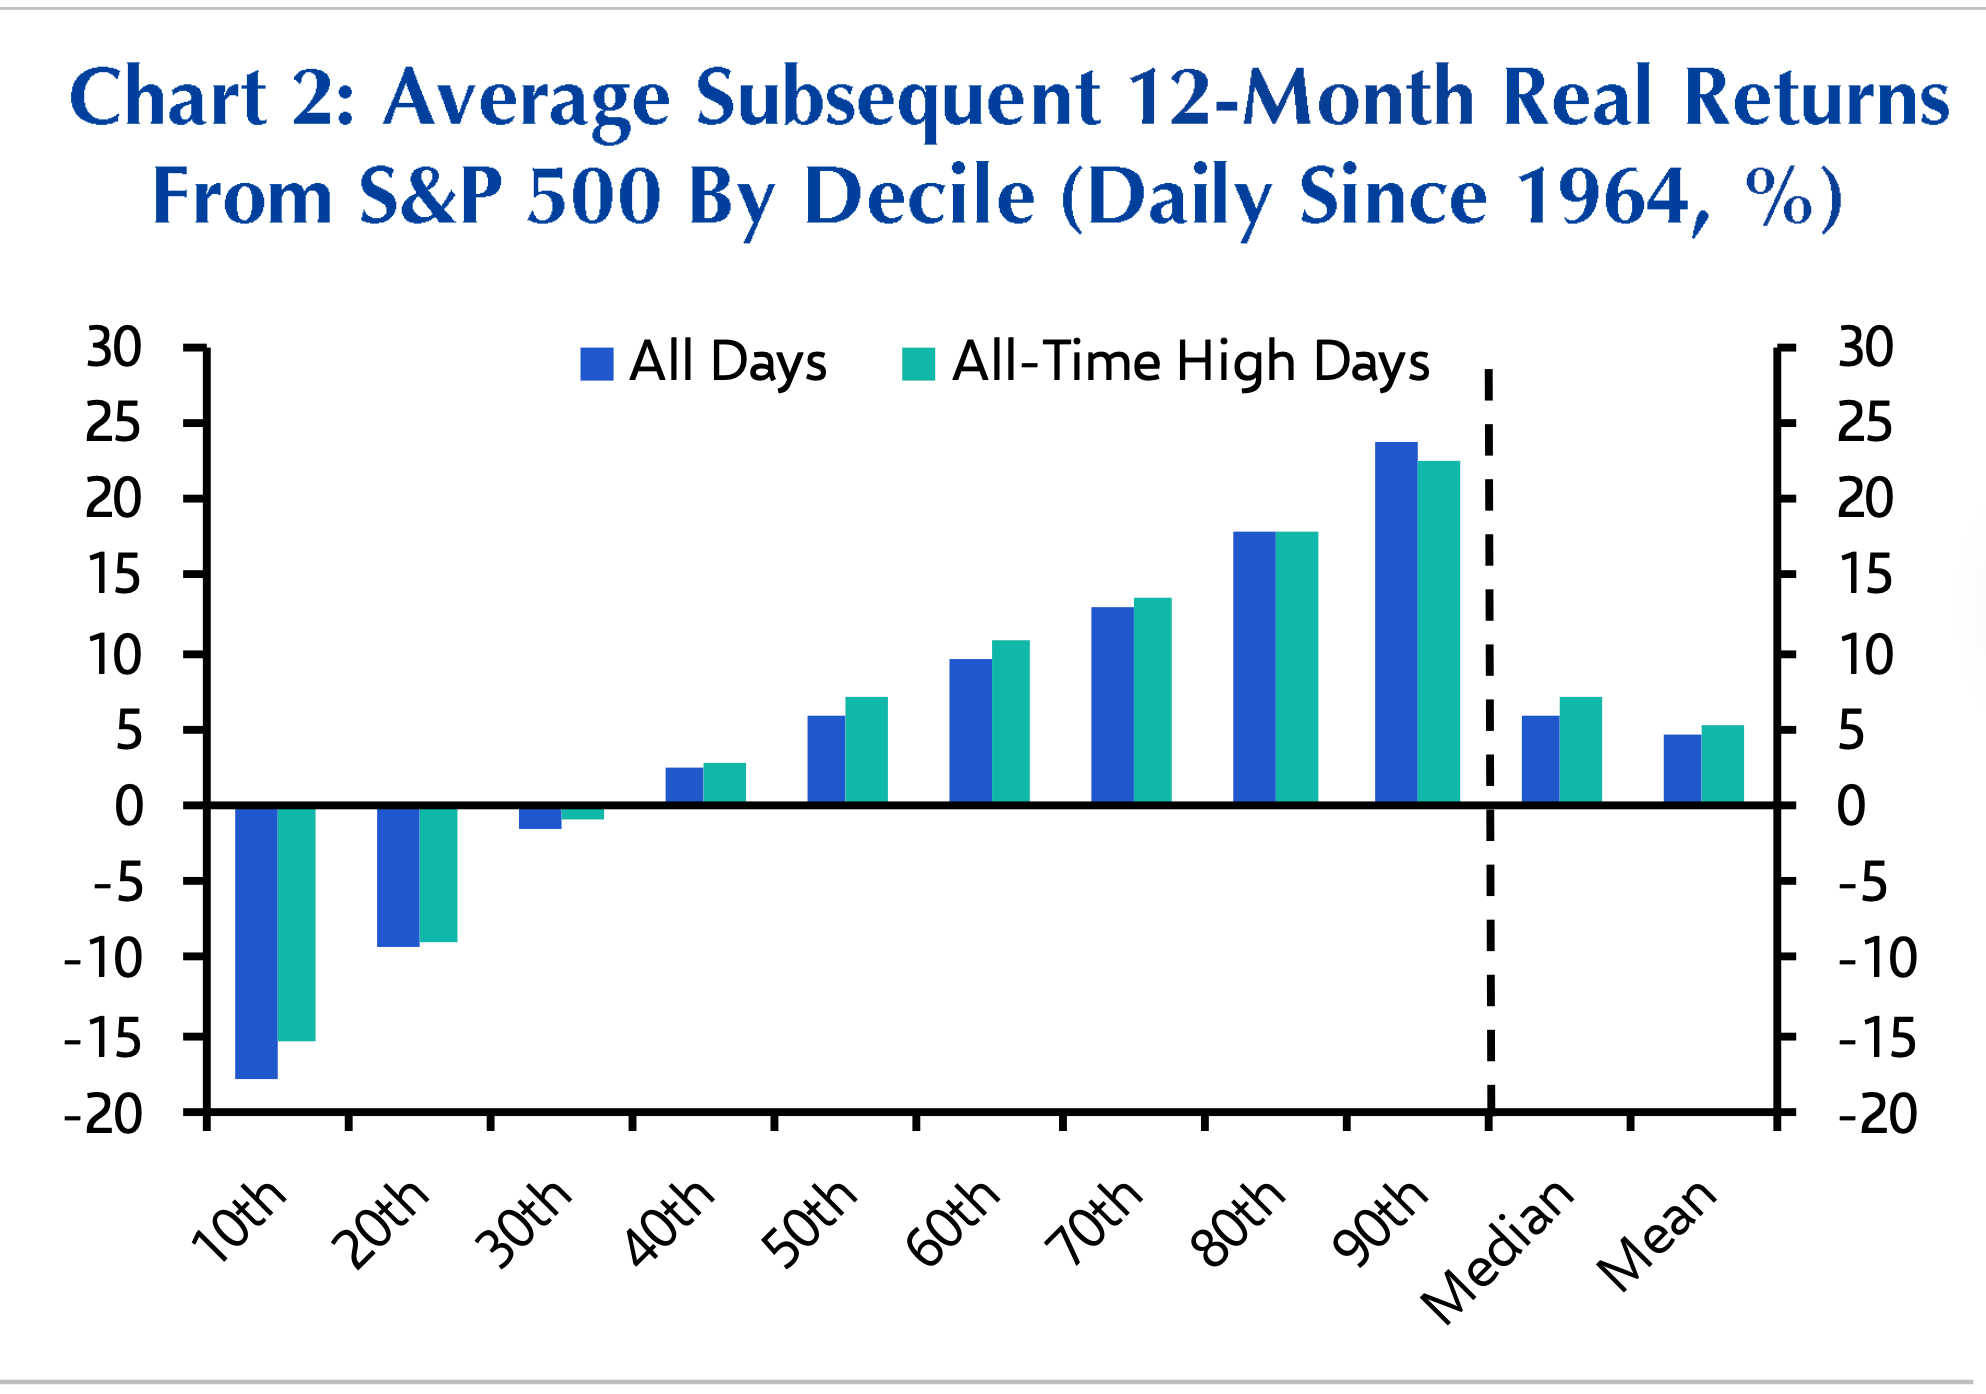
This is consistent with what we know about all-time highs being a great time to buy.
From Capital Economics' James Reilly: "It can be tempting to think the risks must be skewed to the downside. But 12-month inflation-adjusted returns since 1964 have been slightly stronger following new all-time highs compared to the average day. The frequency of significant losses has also been lower after reaching all-time highs, while the distribution of 12-month real returns is similar in both samples."
If you're interested in my experience with all-time highs, read: Checking in on the unluckiest market timer I know 🍀
About Fed rate cuts and stocks ⚖️
The Federal Reserve is expected to announce a rate cut at the conclusion of its monetary policy meeting on Wednesday. This would be a resumption in cuts, which have been on pause since last December.
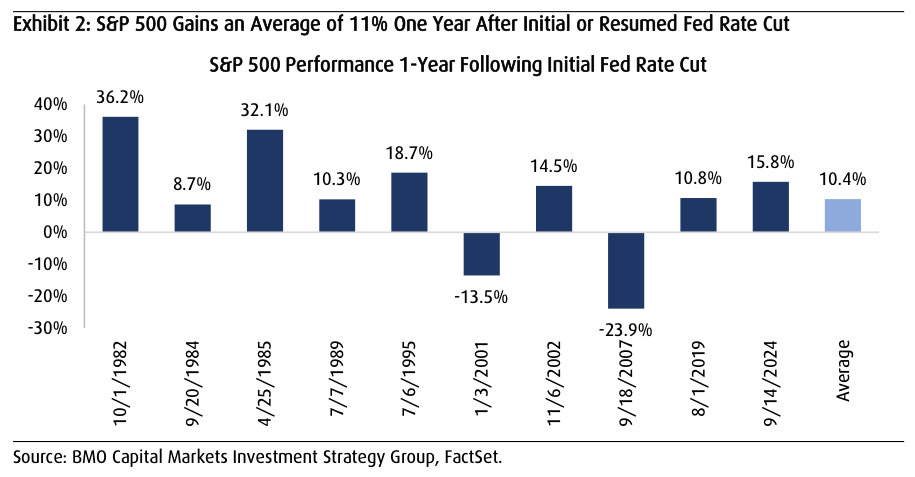
What would a cut mean for stocks?
It's not that simple. Here's BMO's Brian Belski (emphasis added): "We identified ten such cycles going back to 1982 when the Fed started officially announcing its policy actions. According to our analysis, the S&P 500 delivered positive returns in the 12 months following such rate cuts for eight of the ten cycles with an average gain of 10.4%. However, the macro context behind the moves mattered a great deal, which is why performance varied so significantly around these turning points ranging from -23.9% to 32.1%. In cycles where rate cuts were able to prolong economic expansion and keep corporate earnings on an upward trend, stocks performed quite well. However, in cycles where monetary stimulus was unable to prevent an economic downturn (i.e., 2001 and 2007), stocks recorded significant losses in the following year as earnings growth struggled."
Yes, the Fed can have an impact on economic activity. But what ultimately matters for markets is where the economy and corporate earnings head. We've discussed this repeatedly at length. (If you're catching up, read: ‘How many times will the Fed cut rates?’ is not the right question for stock market investors 🔪 or There’s a more important force than the Fed driving the stock market 💪)
A rate cut isn't guaranteed to stimulate growth. In fact, JP Morgan's David Kelly recently warned that rate cuts "could weaken rather than strengthen demand."
Benzinga Disclaimer: This article is from an unpaid external contributor. It does not represent Benzinga’s reporting and has not been edited for content or accuracy.
–
© 2025 Benzinga.com. Benzinga does not provide investment advice. All rights reserved.