Zinger Key Points
- Regional bank stocks drop after NYCB's poor results, stoking sector-wide structural concerns; KRE ETF down 11%.
- $2.77 trillion CRE debt maturing by 2027 pressures banks; NYCB and First Hawaiian Bank most exposed to CRE loans.
- Get access to your new suite of high-powered trading tools, including real-time stock ratings, insider trades, and government trading signals.
Regional bank stocks are experiencing heightened volatility following the release of New York Community Bancorp NYCB’s disappointing quarterly results, reigniting concerns about the sector’s structural challenges.
Investors are particularly scrutinizing the exposure of regional banks to the commercial real estate sector, which faces significant troubles due to declining market values linked to office space prices.
According to data from Trepp, an impressive $2.77 trillion of commercial real estate debt, representing half of all outstanding commercial real estate debt, is scheduled to mature between 2023 and 2027. Notably, nearly $500 billion of this debt is due in 2024 alone and will need to be refinanced.
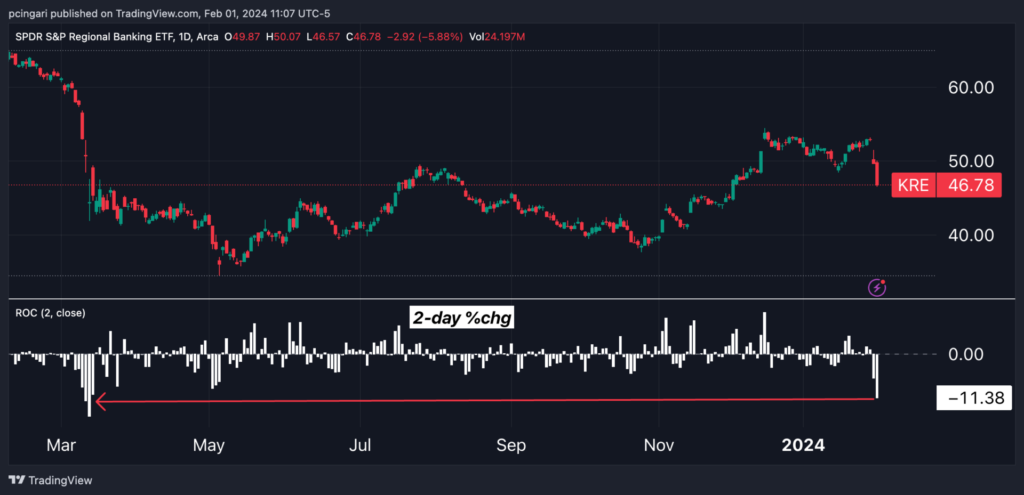
The SPDR S&P Regional Banking ETF KRE, a key gauge for the sector, has fallen over 11% in the last two sessions, putting it on course for its worst two-day performance since March 13, 2023. At that time, regional banks fell in response to the failures of Silicon Valley Bank and Signature Bank, which triggered widespread panic across the industry.
As of 11 a.m. in New York on Thursday, New York Community Bancorp has seen a 46% decline in the last two sessions.
Chart: Regional Banks Under Pressure Again

Worst-Performing Regional Bank Stocks Thursday
| Bank name | Price | Weight In KRE ETF | 1-Day Return |
|---|---|---|---|
| New York Community Bancorp, Inc. | 5.59 | 2.60% | -13.52% |
| Metropolitan Bank Holding Corp. MCB | 42.01 | 0.16 | -13.36% |
| Western Alliance Bancorporation WAL | 57.00 | 4.06 | -10.88% |
| Valley National Bancorp VLY | 8.64 | 1.27 | -10.19% |
| Pinnacle Financial Partners, Inc. PNFP | 79.45 | 1.60 | -10.10% |
| First Foundation Inc. FFWM | 8.61 | 0.23 | -9.61% |
Analysts Assess Regional Bank Risks
Bank of America trimmed New York Community Bancorp’s price target from $13 to $6.50 amid downward revisions to earnings and revenues for 2024, although it maintained a Buy rating on the stock.
“We don’t anticipate a quick rebound in the stock as the Street will need time to digest the significant change in earnings outlook,” BofA Global Research analyst Ebrahim Poonawala said in a note to clients.
Poonawala suggested the fourth quarter may serve as a “kitchen-sink” quarter, implying that investors will expect the earnings outlook to fully account for the severest impacts on credit, liquidity and capital accumulation, and also that management and regulators align closely with NYCB’s balance sheet strategy.
Goldman Sachs is taking a cautious stance regarding the negative earnings report from New York Community Bancorp, attempting to contain the spillover effects to the sector.
Analysts Ryan Nash and Christian DeGrasse said NYCB’s reserves and capital levels are lower than those of regional banking peers under their coverage.
“There could be risk of increased regulatory scrutiny for regional banks as NYCB had previously acquired Signature Bank through FDIC receivership last spring,” the analysts said.
US Regional Bank Exposure To CRE Loans
A Goldman Sachs analysis shows that NYCB has a much higher concentration in commercial real estate (56% of total loans vs. 18% on average for the regionals under coverage).
Ranking second is First Hawaiian Bank FHB, with 30.4% exposure to commercial real estate loans. Additionally, First Hawaiian Bank presents the lowest liquidity position — determined by the ratio of cash and securities to earning assets — among its regional banking counterparts.
| Bank Name | CRE Loans as % of total loans |
|---|---|
| New York Community Bancorp | 56.4 |
| First Hawaiian Bank | 30.4 |
| Synovus Financial Corp. SNV | 25.8 |
| BankUnited BKU | 24.0 |
| First Horizon National Corporation FHN | 22.7 |
| Citizens Financial Group, Inc. CFG | 19.9 |
| M&T Bank Corporation MTB | 18.9 |
| Zions Bancorporation ZION | 18.8 |
| Comerica Incorporated CMA | 17.7 |
| Regions Financial Corporation RF | 15.9 |
| KeyCorp KEY | 12.8 |
| Huntington Bancshares Incorporated HBAN | 10.2 |
| Truist Financial Corporation TFC | 9.4 |
| Fifth Third Bancorp FITB | 9.1 |
| Avg ex. NYCB | 18.1% |
Read now: Assessing New York Community: Insights From 7 Financial Analysts
Photo via Shutterstock.
© 2025 Benzinga.com. Benzinga does not provide investment advice. All rights reserved.
date | ticker | name | Price Target | Upside/Downside | Recommendation | Firm |
|---|
Trade confidently with insights and alerts from analyst ratings, free reports and breaking news that affects the stocks you care about.