Zinger Key Points
- Tesla's Q2 delivery beat drives a 10.20% stock surge, signaling renewed investor confidence.
- Technical indicators show strong bullish momentum for Tesla, with multiple bullish signals across key metrics.
- Our government trade tracker caught Pelosi’s 169% AI winner. Discover how to track all 535 Congress member stock trades today.
Shares of Tesla Inc TSLA rose 10.20% on Tuesday, marking the best intraday session since late April.
The much-needed boost comes as the stock is down 17.35% over the past year and 6.93% year-to-date.
Tesla Q2 Delivery Beat Ignites Rally
Tesla’s impressive Q2 performance, reporting 443,956 deliveries, significantly exceeded the expected 439,000 vehicles. This surprise upside fueled a rally, propelling shares toward their 2024 high. The majority of sales came from the affordable Models 3 and Y, with only 21,551 units from the pricier Models X, S and the new Cybertruck.
Wedbush Securities analyst Dan Ives hailed the quarter as a “huge comeback” for Tesla and CEO Elon Musk. Despite negative sentiment due to choppy EV demand and concerning registration data from Europe and China, Tesla defied expectations.
Ives emphasized Tesla’s positioning as an AI and robotics innovator rather than just a car manufacturer.
Technical Analysis: Bullish Signals Galore
Tesla’s recent price action is generating strong bullish signals across multiple technical indicators:

Chart created using Benzinga Pro
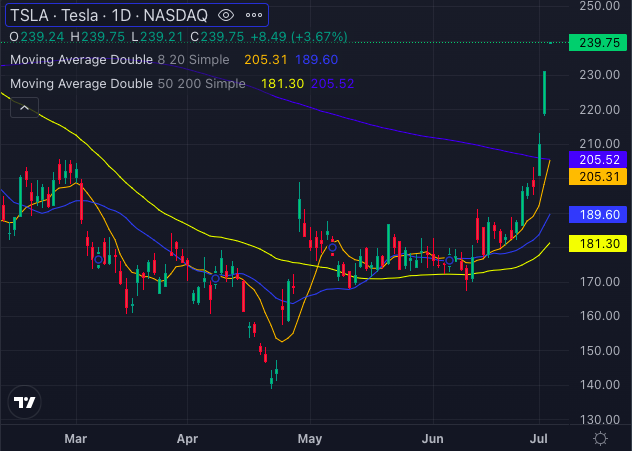
- Moving Averages: Tesla’s price of $239.75 is comfortably above its 5-day, 20-day and 50-day exponential moving averages, indicating robust buying pressure.
- Specifically, the stock is well above its 8-day SMA of $205.31, 20-day SMA of $189.60, 50-day SMA of $181.30 and 200-day SMA of $205.52—all signaling bullish momentum.

Chart created using Benzinga Pro
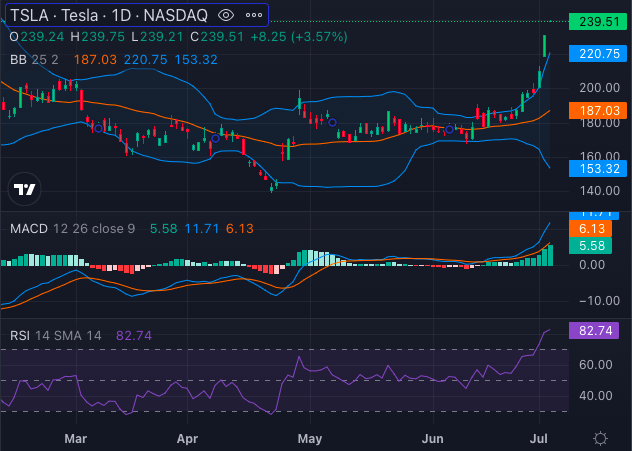
- MACD: The Moving Average Convergence Divergence (MACD) indicator stands at 11.71, suggesting continued bullish momentum.
- RSI: The Relative Strength Index (RSI) is at a high 82.74, indicating the stock is overbought. While this often signals a potential pullback, it can also be a sign of strong upward momentum in a trending market.
- Bollinger Bands: Tesla's Bollinger Bands (25) range between $153.32 and $220.75. With the stock price well above these bands, it's flashing a strong bullish signal.
Tesla's Q2 delivery beat has rekindled investor confidence, driving the stock higher amid previous market skepticism. With technical indicators pointing to bullish momentum, Tesla’s stock appears well-positioned for further gains. However, investors should keep an eye on the high RSI, which could signal overbought conditions.
TSLA Price Check: Shares of Tesla were up 5.02% to $243.40 at last check Wednesday.
Read Next:
Image created using artificial intelligence via Midjourney.
© 2025 Benzinga.com. Benzinga does not provide investment advice. All rights reserved.
date | ticker | name | Price Target | Upside/Downside | Recommendation | Firm |
|---|
Trade confidently with insights and alerts from analyst ratings, free reports and breaking news that affects the stocks you care about.