Bookkeeping: Weekly Changes to Fund Positions Year 3, Week 43

Year 3, Week 43 Major Position Changes

To see historic weekly fund changes click here OR the label at the bottom of this entry entitled 'fund positions'.

Cash: 83.0% (v 84.5% last week)
18 long bias: 13.7% (v 13.5% last week)
3 short bias: 3.3% (v 2.0% last week) [Includes 1 'long dollar' position]

21 positions (vs 20 last week)

Weekly thoughts
A strange week to be sure - a very rare down Monday was followed by a plunge Tuesday morning to February 2010 lows in the S&P 1040s... this led to an intraday bounce of roughly 3%. Thursday also was a +3% day on nothing more than China refuting a report that it was reviewing European debt holdings. So in one week we had two intraday 3% moves; the one on Tuesday was at least "playable" as it happened during the day and we had massively oversold conditions, and a very clearly defined support level. The one Thursday was mostly done in premarket after a very bad previous day close (Wednesday) and hence not useful for anyone but daytraders. To close out the week, rather than the normal quiet, gleeful session we have before a holiday an actual selloff took place ... and a key support level of S&P 1094 was broken.


Not mentioned above is the very strange action in the market day to day - we are seeing vacuums both to the upside and downside which are dangerous to one's portfolio. A week ago there was a 1.5% move up in the last 17-18 minutes of the day and then last Friday the market was crunched to the tune of about 7 S&P points in the closing 4 minutes. Up or down - it is not a sign of a healthy market and seems to display a market without much depth to it. The other issue is every day except Friday we were waking up to +/- 1%+ moves in premarket which are simply impossible to deal with - the headline risk and knee jerk reactions are too much at this moment.

At this point it seems last week was an oversold bounce based on the action Thursday and Friday. Easy to say in retrospect - especially when bears are fearful that old technical analysis rules no longer work since they have been made a mockery of during the move up since March 2009. This time around they seem to actually be working as they used to. While the move up was strong (Tuesday and Thursday were about +6% combined) it simply took the S&P 500 to its 200 day moving average, which actually held this time around. Until this level is recaptured it is difficult to make a bevy of long side moves of intermediate term duration. Everything right now is just traders jumping in and out for hours at a time chasing an algorithm.

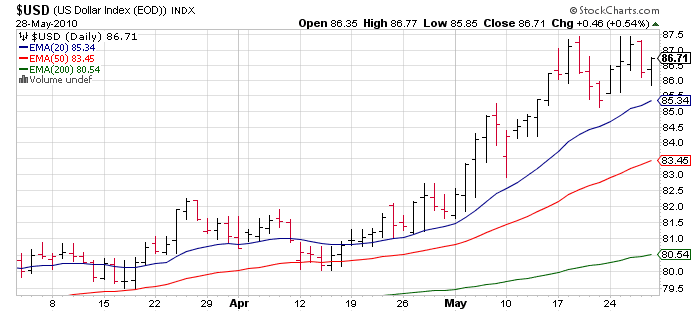
Currencies continue to dominate - last week I sold most of our remaining US dollar exposure thinking maybe we'd have 3-4-5 days of calm but perhaps not. While the dollar did pullback, it did not pullback much - so as I said when I sold our exposure, if the dollar breaks to a new high we'd get some exposure back.


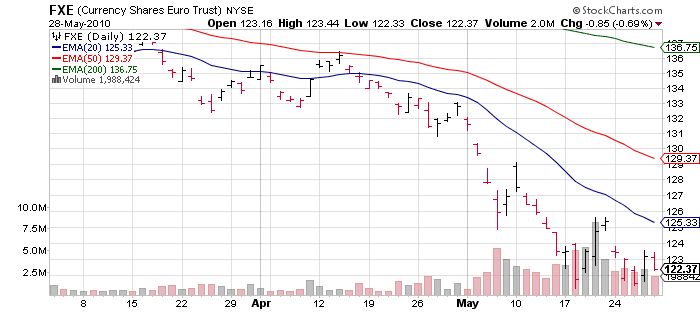
Of course this would mean the Euro is most likely moving to new lows after it experienced an oversold bounce. I was hoping again for a 3-4-5 days of calm and for this currency to jump higher to perhaps short it.


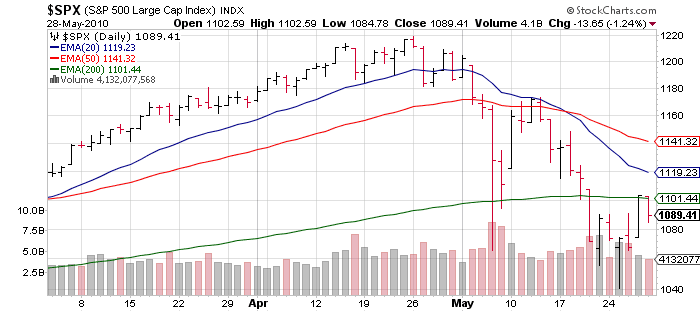
Oversold reading overall still seem extreme - these are levels last seen in March 2009 but leads us unable to find many new ideas as so many stocks are broken and battered. Countless stocks I reviewed show stocks that broke support the past month, and simply used last week's rallies to jump back up to resistance ... these are charts to short, not go long. They are everywhere.

---------------------

June is sort of an off month as earnings reports don't start back up in earnest until July and volume things out even more as vacation season starts for Wall Street. As for economic data all eyes are on Friday's job reports - with 400K census jobs coming in (according to estimates) the calls for job gains of 500-600K are prevalent. Recall last month well over 100,000 jobs were 'created' by the birth/death model (i.e. finger in the air guesswork) - which has been the case, more or less 10 of every 12 months even during the Great Recession. So why change now? This week's reports:

Tuesday - (a) ISM Manufacturing; this has been an area of strength for the U.S. economy as Asia (namely China) chugs along. Unfortunately in the new paradigm domestic economy, manufacturing is only 13% of output and 9% of jobs. Hence ISM Services, which gets much less attention should be the focus. (b) Construction Spending

Wednesday - Pending Home Sales

Thursday - (a) ISM Services; this has turned up to expansion the past few months; consensus is a reading just under 56. At this point other than jobs this is probably the most important report. (b) Factory Orders (c) Productivity & Costs

Friday - (a) Jobs.

----------------------------------

For the portfolio there was little to do. I was mostly out of most major positions except for 2 - Tibco Software (TIBX) and F5 Networks (FFIV) and the early week selloff effectively had me cutting back these last 2 holdouts, which marked the short term bottom. The rest of the week I did some reconfiguring and cleaning up - mostly moving from weaker charts to stronger charts but not really changing my allocations much since the market was so volatile and was still below the 200 day moving average. The one positive of the current market is relative strength is obvious .. much more so when everything is rising up in one monolith.

On the long side:
  • Tuesday, as the market swooshed down I was taken out of larger positions in F5 Networks (FFIV) and Tibco Software (TIBX) as they finally broke support... F5 regained support by the end of the day as the market rallied from -3% to flat for the day. Both positions were pared back.
  • Intercontintental Exchange (ICE) was closed simply because I wanted to open spots for other positions in the fund; however the stock regained support by the end of the week as well showing some nice relative strength.
  • I began stakes in Polaris Industries (PII) and Valassis Communications (VCI) both on relative strength in their charts - the former name also announced they were moving hundreds of jobs to Mexico and away from America. What's not to love as a dog eat dog capitalist?
  • Thursday, I closed NetLogic Microsystems (NETL) as the stock had broken support and rallied into resistance. One of hundreds upon hundreds of similar charts, which scream short rather than long.
  • I replaced NETL with Chinese chip market Spreadtrum Communications (SPRD) - which probably has the strongest chart of any right now in the market. The only problem is it is overextended; hence just a starter stake.
  • Quality Systems (QSII) reported and missed, somehow the stock was only down 5% - but with the chart broken I decided to part ways and look to replace it with something else in the future.

On the short side:
  • Wednesday, I sold the majority of the remaining long dollar position in Powershares DB US Dollar Bullish (UUP).
  • Thursday on the swoosh up day, I attempted to short both Ross Stories (ROST) and Steve Madden (SHOO) - 2 retailers. I was stopped out of the Steve Madden position within hours for a minor loss.
Market News and Data brought to you by Benzinga APIs
Comments
Loading...
Posted In: Apparel RetailApplication SoftwareCommunications EquipmentConsumer DiscretionaryFinancialsFootwearInformation TechnologyLeisure ProductsPublishingSemiconductorsSpecialized FinanceSystems Software
Benzinga simplifies the market for smarter investing

Trade confidently with insights and alerts from analyst ratings, free reports and breaking news that affects the stocks you care about.

Join Now: Free!