Friday stocks staged another retreat just when bulls were looking for upside follow-through. Instead of a nice push above the 50-day moving average, confirming the bullish trend, we got a 3% drop that wiped out more than a week's worth of gains. Now, charts are shaping to show lower highs and lower lows - the classic definition of a down trend.
The view from Alert HQ --
The data for the following charts is generated from our weekly Alert HQ process. We scan roughly 6040 stocks and ETFs each weekend and gather the statistics presented below. First, here's the two charts and I'll summarize my interpretation at the end.
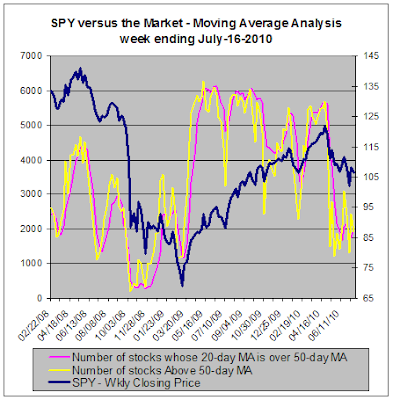
In the chart below we count the number of stocks above various moving averages and count the number of moving average crossovers, as well. We then plot the results against a chart of the SPDR S&P 500 ETF (SPY).
The next chart provides our trending analysis. It looks at the number of stocks in strong up-trends or down-trends based on Aroon analysis.

OK, the price chart of SPY is now looking pretty awful. These two charts, however, while clearly reflecting Friday's weakness, are at the same time looking kind of "bottom-ish" if such a word exists.
The Moving Average Analysis chart shows a zig-zag of the yellow line above and below the magenta line. Neither line has established new lows recently, hence the "bottom-ish" characterization. The Trending Analysis chart shows a continued decline in the number of stocks in a down-trend. Unfortunately, it also shows that the number of stocks in up-trends has reverted to a relatively low level, and it seems it will be a struggle to increase. This is certainly not a bullish chart but it is still sort of bottom-ish.
This next chart shows SPY over the course of the last year. What is highlighted is the downward wedge that the ETF seems to be trapped in.

The bears look at this chart and see SPY continuing down this channel, fulfilling the dark promise of the "death cross" when the 50-DMA crossed below the 200-DMA. The failure to break over the top trendline is a telling sign showing that we are truly in a bear market. Many expect SPY to drop out of this channel which would probably result in a quick drop to the $92.50 range
The bulls look at this same chart and say "Hey, isn't a falling wedge a bullish formation?" Of course, the answer is Yes only if we finally break out to the upside, something that looks more challenging now that SPY has been rebuffed so soundly at that falling upper trendline shown in the chart above.
The bulls may just be biding their time and hoping for a strong reversal sign. Take a look at the chart below:

You can see a potential head-and-shoulders set up. The optimists are OK with a pullback in SPY as long as the ETF fulfills this pattern.
Could it happen as the bulls hope?
Only time will tell but I thinks earnings will have an impact. There are a good number of bellwether companies reporting this week including IBM (IBM), Texas Instruments (TXN), Johnson & Johnson (JNJ), PepsiCo (PEP), Goldman Sachs (GS), Coca-Cola (KO), Morgan Stanley (MS), AT&T (T), Caterpillar (CAT), UPS (UPS) and Amazon.com (AMZN). If we can get a consistent set of good reports combined with positive outlooks then Friday's market slide might be arrested.
In terms of economic reports, the bulls will probably be swimming against the tide. We have a bunch of housing related reports coming up and they are all likely to range from lackluster to awful. These reports include National Homebuilders Association Index, Building Permits, Housing Starts and Existing Home Sales. In addition to the usual weekly jobless claims we will also have the latest report of leading indicators from the Conference Board.
There has been a lot of attention paid recently to the ECRI weekly indicators. There is a difference between the two as well as some similarities. For example, here is what the Conference Board takes into consideration when constructing their index:
The index of leading indicators includes the ten economic statistics listed below.
So it's clear the two sets of indicators will not track exactly but both will show slowing growth based on the items they have in common. And since both track stock prices, it becomes somewhat of a self fulfilling prophecy that the indicators will decline when stocks do. I'd love to see these two without the impact of stock prices given how volatile and crazy the markets have been lately.
So the battle between bulls and bears and between double-dippers and economic optimists continues. Expect the outcome to see-saw back and forth for weeks to come before we see a resolution.


Market News and Data brought to you by Benzinga APIsThe view from Alert HQ --
The data for the following charts is generated from our weekly Alert HQ process. We scan roughly 6040 stocks and ETFs each weekend and gather the statistics presented below. First, here's the two charts and I'll summarize my interpretation at the end.
In the chart below we count the number of stocks above various moving averages and count the number of moving average crossovers, as well. We then plot the results against a chart of the SPDR S&P 500 ETF (SPY).

The next chart provides our trending analysis. It looks at the number of stocks in strong up-trends or down-trends based on Aroon analysis.

OK, the price chart of SPY is now looking pretty awful. These two charts, however, while clearly reflecting Friday's weakness, are at the same time looking kind of "bottom-ish" if such a word exists.
The Moving Average Analysis chart shows a zig-zag of the yellow line above and below the magenta line. Neither line has established new lows recently, hence the "bottom-ish" characterization. The Trending Analysis chart shows a continued decline in the number of stocks in a down-trend. Unfortunately, it also shows that the number of stocks in up-trends has reverted to a relatively low level, and it seems it will be a struggle to increase. This is certainly not a bullish chart but it is still sort of bottom-ish.
This next chart shows SPY over the course of the last year. What is highlighted is the downward wedge that the ETF seems to be trapped in.

The bears look at this chart and see SPY continuing down this channel, fulfilling the dark promise of the "death cross" when the 50-DMA crossed below the 200-DMA. The failure to break over the top trendline is a telling sign showing that we are truly in a bear market. Many expect SPY to drop out of this channel which would probably result in a quick drop to the $92.50 range
The bulls look at this same chart and say "Hey, isn't a falling wedge a bullish formation?" Of course, the answer is Yes only if we finally break out to the upside, something that looks more challenging now that SPY has been rebuffed so soundly at that falling upper trendline shown in the chart above.
The bulls may just be biding their time and hoping for a strong reversal sign. Take a look at the chart below:

You can see a potential head-and-shoulders set up. The optimists are OK with a pullback in SPY as long as the ETF fulfills this pattern.
Could it happen as the bulls hope?
Only time will tell but I thinks earnings will have an impact. There are a good number of bellwether companies reporting this week including IBM (IBM), Texas Instruments (TXN), Johnson & Johnson (JNJ), PepsiCo (PEP), Goldman Sachs (GS), Coca-Cola (KO), Morgan Stanley (MS), AT&T (T), Caterpillar (CAT), UPS (UPS) and Amazon.com (AMZN). If we can get a consistent set of good reports combined with positive outlooks then Friday's market slide might be arrested.
In terms of economic reports, the bulls will probably be swimming against the tide. We have a bunch of housing related reports coming up and they are all likely to range from lackluster to awful. These reports include National Homebuilders Association Index, Building Permits, Housing Starts and Existing Home Sales. In addition to the usual weekly jobless claims we will also have the latest report of leading indicators from the Conference Board.
There has been a lot of attention paid recently to the ECRI weekly indicators. There is a difference between the two as well as some similarities. For example, here is what the Conference Board takes into consideration when constructing their index:
The index of leading indicators includes the ten economic statistics listed below.
- The interest rate spread between 10-year Treasury notes and the federal funds rate.
- The inflation-adjusted, M2 measure of the money supply.
- The average manufacturing workweek.
- Manufacturers' new orders for consumer goods and materials.
- The S&P 500 measure of stock prices.
- The vendor performance component of the NAPM index.
- The average level of weekly initial claims for unemployment insurance.
- Building permits.
- The University of Michigan index of consumer expectations.
- Manufacturers' new orders for nondefense capital goods.
- The Mortgage Bankers Association's home purchase index
- Money supply
- Stock prices
- Initial jobless claims
- Corporate yield spreads (inverted)
- Corporate bond quality spread
So it's clear the two sets of indicators will not track exactly but both will show slowing growth based on the items they have in common. And since both track stock prices, it becomes somewhat of a self fulfilling prophecy that the indicators will decline when stocks do. I'd love to see these two without the impact of stock prices given how volatile and crazy the markets have been lately.
So the battle between bulls and bears and between double-dippers and economic optimists continues. Expect the outcome to see-saw back and forth for weeks to come before we see a resolution.
© 2024 Benzinga.com. Benzinga does not provide investment advice. All rights reserved.
Comments
Loading...
Posted In:
Air Freight & LogisticsComputer HardwareConstruction & Farm Machinery & Heavy TrucksConsumer DiscretionaryConsumer StaplesFinancialsHealth CareIndustrialsInformation TechnologyIntegrated Telecommunication ServicesInternet RetailInvestment Banking & BrokeragePharmaceuticalsSemiconductorsSoft DrinksTelecommunication Services
Benzinga simplifies the market for smarter investing
Trade confidently with insights and alerts from analyst ratings, free reports and breaking news that affects the stocks you care about.
Join Now: Free!
Already a member?Sign in

