


Year 4, Week 15 Major Position Changes
To see historic weekly fund changes click here OR the label at the bottom of this entry entitled 'fund positions'.
Cash: 60.8% (v 60.9% last week)
22 long bias: 38.4% (v 38.3% last week)
3 short bias: 0.8% (v 0.7% last week)
25 positions (vs 25 last week)
Weekly thoughts
After a non stop melt up for 2.5 months, the markets took a well deserved breather last week based on (a) Irelandproblems pending bailout and (b) potential Chinese rate hikes due to inflation concerns. But it was not easy for bears ... it still took 3 bad opens in a row (the first two reversed back up) to finally cause any meaningful selloff. The reality is the market needed to let off some stream, and any good reason would do - Ireland and China worked as a catalyst this time around.
With that the 13 day moving average was broken to the downside for the first time since the 2nd day of September... this level has been a useful 'buy signal' area, so the 'easy' trade becomes a bit less so. Normally the 20 day moving average is a better gauge for support during a rally, but this market has been so unrelenting we never saw those levels, until Friday.
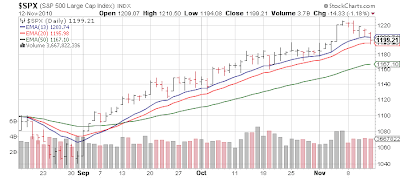
With the 20 day moving average in the mid 1190s, and the 200 WEEK simple moving average at 1192 bulls and bears alike both have their bogey. As long as the S&P 500 holds these levels, any moves down will be muted. If stocks break below the 1192 level in particular, a change should be afoot.
Probably more interesting than the stock market, was some of the action in bonds. Despite the first day of QE2, yields on longer term debt actually spiked (as prices fell)... completely opposite to what one would assume. That said, there were other global issues causing cross currents, so we'll see how bonds play out over the intermediate term.

The "can't lose" commodities trade also finally took a hit, with some huge reversals starting mid week - especially of a silver and sugar kind - and continued throughout the complex as speculators overwhelm the natural supply and demand curve. Risk was "off" after being "on" for months on end.
------------------------------------
Economics
As earnings season winds down, there is an absence of news in the coming weeks. Thanksgiving week is normally (from anecdotal experience, not data) one of great joy in the markets as the retail crowd takes over, driving nonsense stocks up to the moon whilemillions thousands of viewers tune in to CNBC Black Friday morning to see street reporters tell us how "the shopping season is off to a ROARING start... based on the parking lot." Of course never in the past 20 years have the parking lots not told these reporters we'd have a booming Christmas.... I can write the Friday AM story myself at this point.
Economic data still did not matter last week as the primary drivers were of an overseas nature. Hence until they begin to matter I'm on strike discussing them. Some inflation figures, housing starts, and industrial production are the main ones for the week.
POMO? Every day this week. But as I wrote last week, it was a strategic error to make it all day, every day - the magic will disappear.
General Motors will IPO this week which should gather much of the attention.
-------------------------------------
Portfolio
With a quiet week on the economic front, overseas news mattered more.... along with a miss by Cisco Systems (CSCO) [which the market immediately attempted to forget]. Key commodities corrected, but all in all no real damage yet to the bulls.... they have had 1 day of pain compared to seemingly dozens in a row for bears.
For the fund, the week end positions are a bit deceiving - they look almost identical, but I was busy hedging intraday with index puts in a relatively aggressive fashion. Indeed 3 days last week I was in with SPY puts, creating enough profits to offset long side losses from Thursday and Friday. Frankly most positions on the long side did not sell off much at all. If the 200 week moving average is broken this week or in coming weeks, a change of portfolio direction will ensue but for now it is simply a case of more caution and tighter stop losses. Silver Wheaton (SLW) was a star for the portfolio this week.
On the long side:
On the short side:


To see historic weekly fund changes click here OR the label at the bottom of this entry entitled 'fund positions'.
Cash: 60.8% (v 60.9% last week)
22 long bias: 38.4% (v 38.3% last week)
3 short bias: 0.8% (v 0.7% last week)
25 positions (vs 25 last week)
Weekly thoughts
After a non stop melt up for 2.5 months, the markets took a well deserved breather last week based on (a) Ireland
With that the 13 day moving average was broken to the downside for the first time since the 2nd day of September... this level has been a useful 'buy signal' area, so the 'easy' trade becomes a bit less so. Normally the 20 day moving average is a better gauge for support during a rally, but this market has been so unrelenting we never saw those levels, until Friday.

With the 20 day moving average in the mid 1190s, and the 200 WEEK simple moving average at 1192 bulls and bears alike both have their bogey. As long as the S&P 500 holds these levels, any moves down will be muted. If stocks break below the 1192 level in particular, a change should be afoot.
Probably more interesting than the stock market, was some of the action in bonds. Despite the first day of QE2, yields on longer term debt actually spiked (as prices fell)... completely opposite to what one would assume. That said, there were other global issues causing cross currents, so we'll see how bonds play out over the intermediate term.

The "can't lose" commodities trade also finally took a hit, with some huge reversals starting mid week - especially of a silver and sugar kind - and continued throughout the complex as speculators overwhelm the natural supply and demand curve. Risk was "off" after being "on" for months on end.
------------------------------------
Economics
As earnings season winds down, there is an absence of news in the coming weeks. Thanksgiving week is normally (from anecdotal experience, not data) one of great joy in the markets as the retail crowd takes over, driving nonsense stocks up to the moon while
Economic data still did not matter last week as the primary drivers were of an overseas nature. Hence until they begin to matter I'm on strike discussing them. Some inflation figures, housing starts, and industrial production are the main ones for the week.
POMO? Every day this week. But as I wrote last week, it was a strategic error to make it all day, every day - the magic will disappear.
General Motors will IPO this week which should gather much of the attention.
-------------------------------------
Portfolio
With a quiet week on the economic front, overseas news mattered more.... along with a miss by Cisco Systems (CSCO) [which the market immediately attempted to forget]. Key commodities corrected, but all in all no real damage yet to the bulls.... they have had 1 day of pain compared to seemingly dozens in a row for bears.
For the fund, the week end positions are a bit deceiving - they look almost identical, but I was busy hedging intraday with index puts in a relatively aggressive fashion. Indeed 3 days last week I was in with SPY puts, creating enough profits to offset long side losses from Thursday and Friday. Frankly most positions on the long side did not sell off much at all. If the 200 week moving average is broken this week or in coming weeks, a change of portfolio direction will ensue but for now it is simply a case of more caution and tighter stop losses. Silver Wheaton (SLW) was a star for the portfolio this week.
On the long side:
- Monday, I sold 50% of Silver Wheaton (SLW) ahead of earnings for a nearly 20% gain from the entry point the previous week. Tuesday, I sold the rest as silver had gone parabolic - this specific stock was up 29% from my entry point... in 7 days.
- A position in VMWare (VMW) was restarted as the name finally showed some life after some poor action for a month or two.
- Tuesday, BorgWarner (BWA) announced some good long term news, but the stock did not react much; that said it was extended so I took 1/5th off the table after a nice run to lock in some profits.
- Wednesday, Blackstone Group (BX) was closed even though the chart was still solid, but a limit purchase order to add to Gafisa (GFA) as it filled a month long gap, offset the exposure.
- In an atypical move, I restarted a position a horrid chart - in EnerNOC (ENOC) - the company was punished on guidance in an earnings report and fell near a yearly low. This provided a lower risk type of entry - if new yearly lows were created, one can stop out.
- As crude oil broke over yearly highs of $87, I bought Proshares Ultra Crude Oil (UCO) - but sold out of it Friday at loss as crude gapped down on the Friday morning selloff.
- Thursday, Baidu (BIDU) broke to new highs (barely) on huge volume so I doubled the position.
- The Men's Warehouse (MW) broke out of month long range to new high's, so I created a position, opining this might be the "Men's Warehouse top".
- Eastman Chemical (EMN) was closed as it seemed toppy.
- A modest TNA ETF (3x small cap bullish) was put on late Friday, assuming a Monday morning "happy time" as has been the pattern 95% of the Monday's since March 2009.
On the short side:
- Tuesday, I created an intraday 5% SPY put position, as the S&P 500 broke back down below the key 1220 level (which were yearly highs) - those were sold for an "ok" profit in a few hours as the selloff was more muted than I thought. I put the exact same trade on in smaller size late in the day (3% exposure) as the market closed below 1220 and near day lows. I did have overnight risk due to this, but the market opened down Wednesday and fell to the 1204 level where I was happy to take a nice 32% type of profit.
- Friday after the market opened down 3 days in a row, I noted how it would be completely out of bounds for there to be 3 reversals up in a row. So after the now "buy in your sleep" buy the dip in the morning, the market reversed down and I once more bought a 5% exposure using SPY puts; I thought the selling could pick up simply because 3 reversals in a row seemed improbable.... this is what happened. I sold off the position in 3 increments with the best being in the 1194s area (which was just below the 20 day moving average) - a nice win.
Market News and Data brought to you by Benzinga APIs
© 2024 Benzinga.com. Benzinga does not provide investment advice. All rights reserved.
Posted In:
Apparel RetailAsset Management & Custody BanksAuto Parts & EquipmentCommunications EquipmentConsumer DiscretionaryDiversified ChemicalsDiversified Commercial & Professional ServicesFinancialsHomebuildingIndustrialsInformation TechnologyInternet Software & ServicesMaterialsPrecious Metals & MineralsSystems Software
Benzinga simplifies the market for smarter investing
Trade confidently with insights and alerts from analyst ratings, free reports and breaking news that affects the stocks you care about.
Join Now: Free!
Already a member?Sign in

