A LONG-TERM PERSPECTIVE ON DR. COPPER
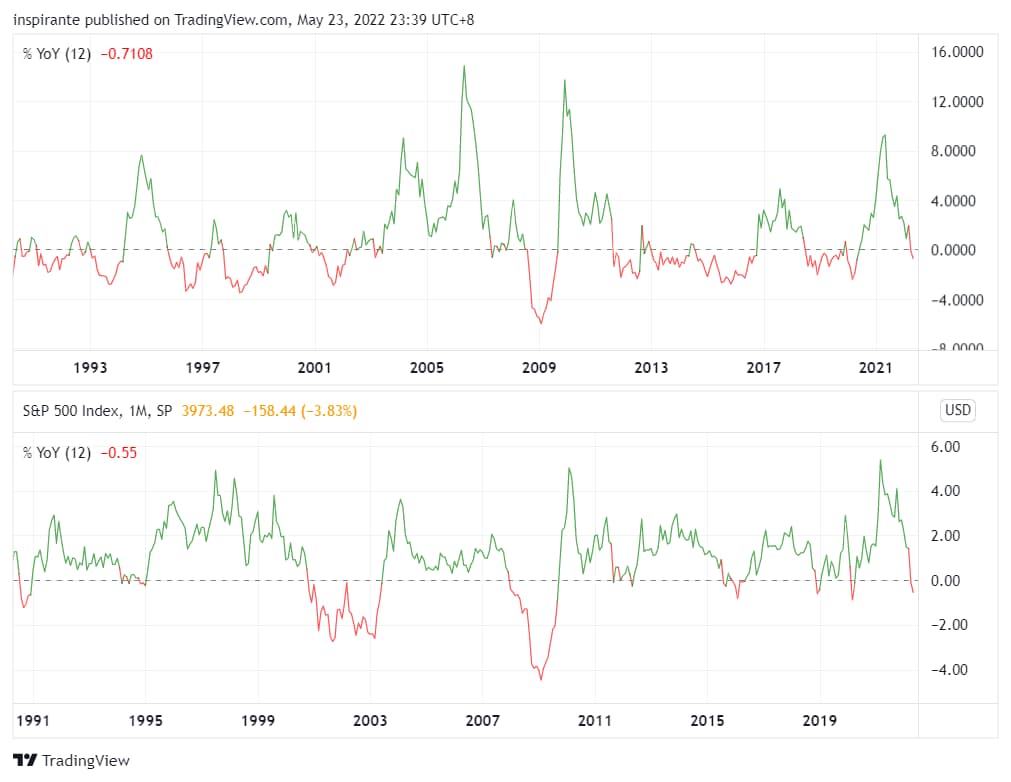
Copper is one of the most important base metals because of its wide usage in many sectors of the economy. The demand for copper has been a reliable leading indicator of global economic health. The year-over-year (YoY) change in copper price correlates well with that of the ISM Manufacturing PMI, which is widely considered a key indicator of the state of the US economy (Figure 1). The correlation of the YoY change between copper price and the S&P 500 index suggests this base metal is also a reliable barometer of the economic cycles (Figure 2). Hence the market lingo “Dr. Copper.”
Figure 1 Copper (% YoY) vs. ISM Manufacturing Index (% YoY)
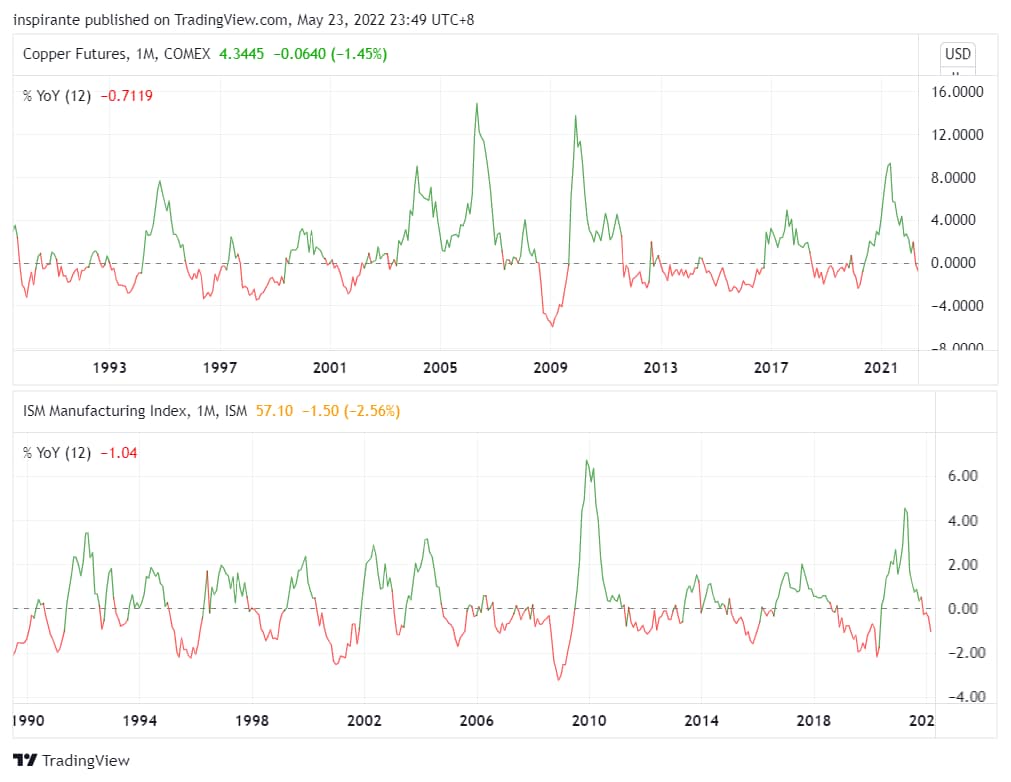
Figure 2 Copper (% YoY) vs. S&P 500 (% YoY)
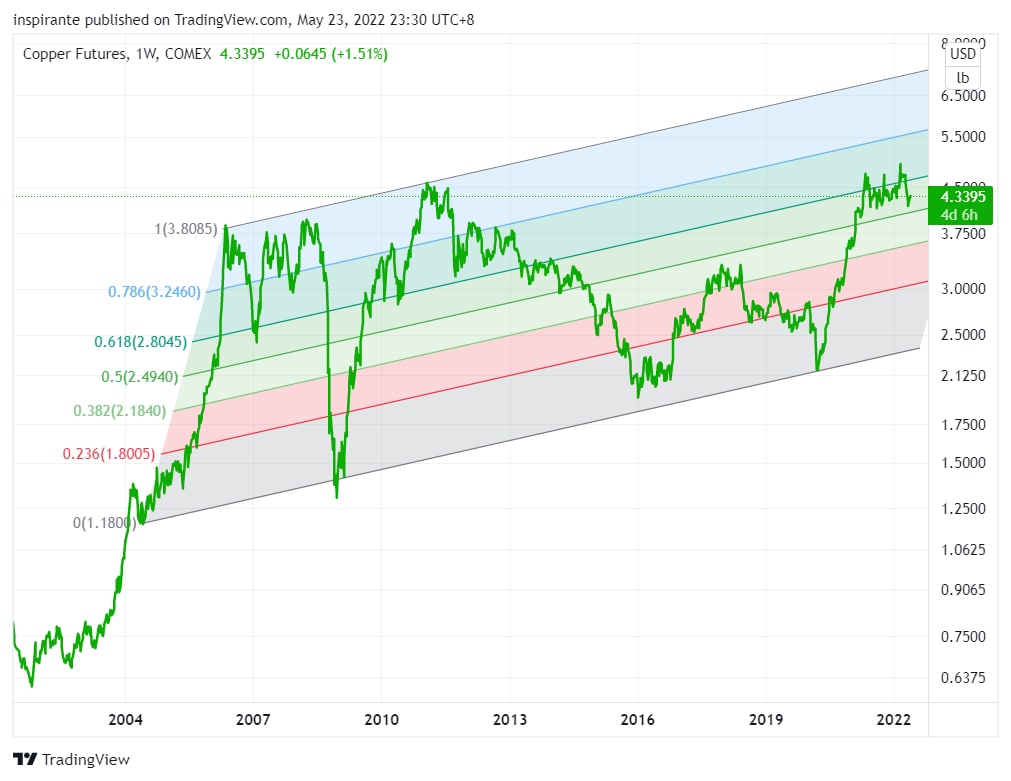
Since 2014, the copper price has moved in a well-defined uptrend channel (log scale), despite a few “booms and busts” during the economic cycles of 2004-2008, 2009-2016, and 2017-2020. Subsequently, it peaked in March 2022, spurring fears that the commodity could be running “too hot.” However, looking into the Fibonacci channel in Figure 3 gives us a very different long-term perspective.

Scan the above QR code for more expert analysis of market events and trends driving opportunities today!
The copper price bottomed in March 2020 as COVID-19 rattled the global economy and financial market. Since then, it has rebounded to just above the 61.8% Fibonacci channel and now consolidating near the 50%. In two of the three previous cycles since 2004 (except for the truncated one between 2017 and 2020), the copper price rallied all the way to the top of the channel. Such magnitude could usually be found for Dr. Copper in a complete cycle. If so, after consolidation and quite possibly some more retracement, the copper price could eventually reach US$7 per pound in the next few years.
Figure 3 Generic 1st Copper Futures (Weekly)
The ongoing global energy transition, as a dominating driver of copper demand in this cycle, boosts both copper demand and copper production costs. The fast adoption of electric vehicles (EV) is an example. Global EV sales “reached 6.3 million in 2021, up 102% year on year, with this number expected to rise to 26.8 million units in 2030, according to the latest analysis from S&P Global Platts Analytics”[1]. The Global X Autonomous & Electric Vehicles ETF proxied the relationship between copper demand and EV adoption (Figure 4). Erik Norland, senior economist at CME Group, has explored the fundamentals behind the recent copper rally and its outlook in Reasons for Copper’s Record Rally.
Figure 4 Copper vs. DRIV (Global X Autonomous & Electric Vehicles ETF)

Post-pandemic price actions
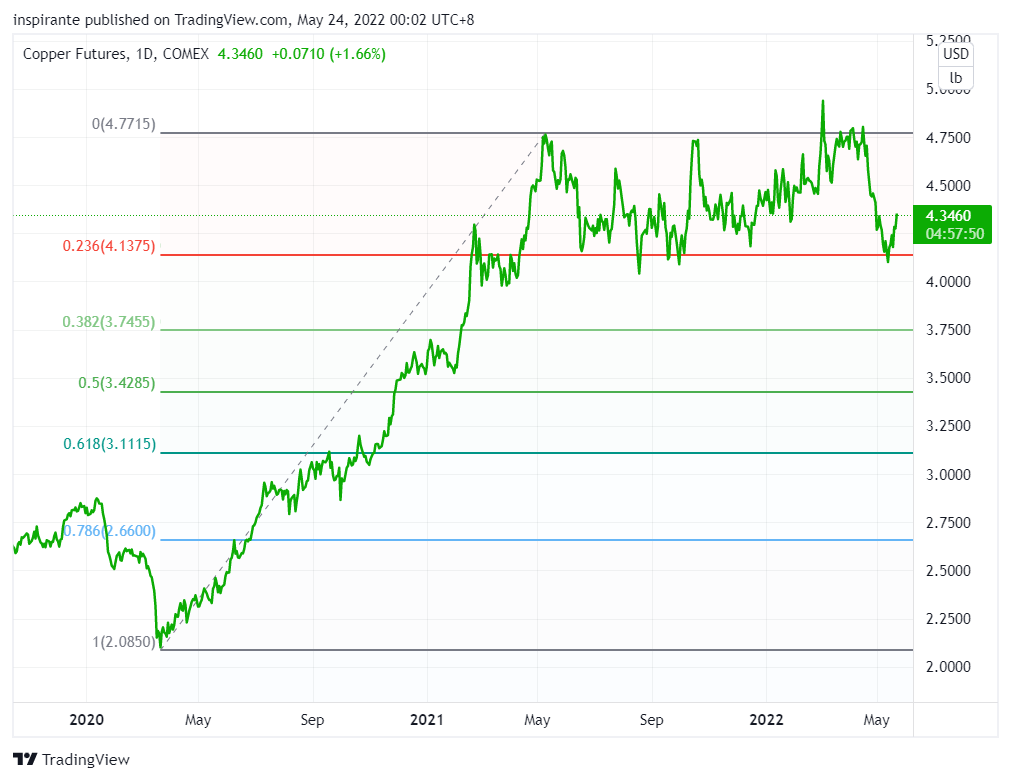
From the March 2020 low, the copper price rallied nearly 150% to above 4.80 in May 2021. Both the speed and magnitude of the move have been staggering. Thereafter, copper has been stuck in a consolidation range for the following twelve months. We saw the price spike above 5.00 in March 2022, but it turned out to be a false break. The rally was determinedly rejected, and the price fell sharply.
4.00 – 4.20 has proven to be a significant support region; it is psychologically important as the bulls would ferociously defend the 4.00 level and the 23.6% Fibonacci retracement level of the post-pandemic rally. This is where investors need to watch closely. If the price breaks down further, we could only find the next meaningful support at 3.75 and then 3.50.
Figure 5 COMEX Generic 1st Copper Futures
Case Study 12
To express the bullish short-term view of copper, an investor could take advantage of the recent selloff to establish long positions at a lower cost. He could buy the Micro Copper future (MHGN2) at 4.30 and set the stop below 4.00. His maximum loss per contract would be (4.30 – 4.00) x 2500 = 750 USD. The initial target is 4.75, resulting in (4.75 – 4.3) x 2500 = 1125 USD.
Subsequently, the investor could buy on strength and pyramid into the position if copper decisively breaks out above 5.00. The next major leg higher will likely start then.
Case Study 2
To express the bullish long-term view of copper in the current economic cycle, an investor could adopt a Dollar Cost Averaging (DCA) method to establish long copper positions gradually. He could be buying the Micro Copper futures on weakness to lower the cost basis of the holding. However, position sizing is of paramount importance for DCA. The investor needs to keep in mind the desired total exposure and acceptable risk amount to work out the sizing of each entry.
Case Study 3
An investor who holds a bearish short-term view of copper but prefers reduced exposure could construct a calendar spread by simultaneously selling the front-month Micro Copper future (MHGN2) and buying the back-month future (MHGU2). If the term structure of copper goes into deeper contango, i.e., front-month contracts experience more selling pressure than the back-month, the position would be in profit as the spread widens.
Case Study 4
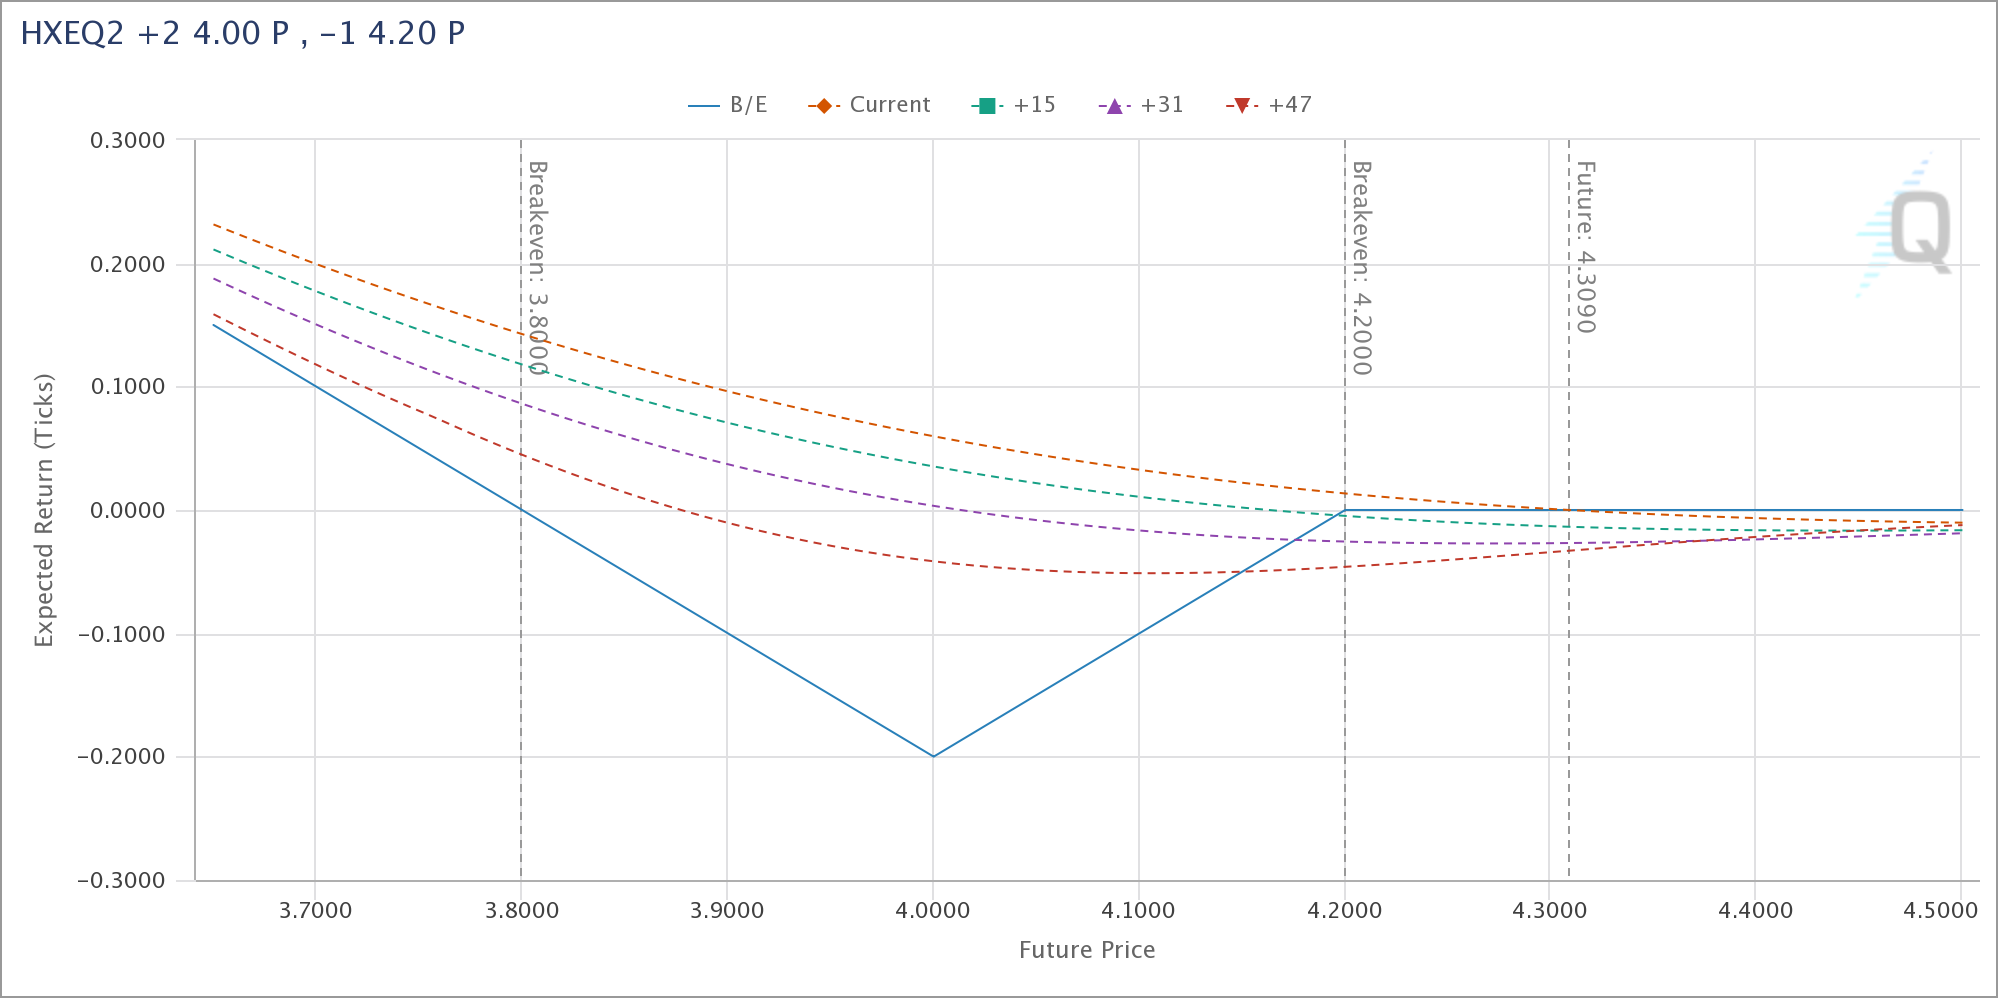
An advanced investor familiar with options and holding a bearish short-term view of copper could construct a Long Ratio Put Spread in anticipation of the near-term market selloff and possible recession. For example, he could buy 2 HKEQ2 4.00 Put and sell 1 HKEQ2 4.20 Put at a net 0 premium. This ratio spread has around 60 days till expiration, and the maximum loss is (4.20 – 4.00) x 25000 = 5000 USD if the underlying settles at 4.00 at expiry. The breakeven point is around 3.80, and anything below that would result in a positive return. The payout diagram is shown in Figure 6.
Figure 6 Payout Diagram of HXEQ2 +2 4.00 P, -1 4.20 P Ratio Put Spread
Cross-asset relationships
Next, we want to zoom in on Dr. Copper’s relationship with other major assets.
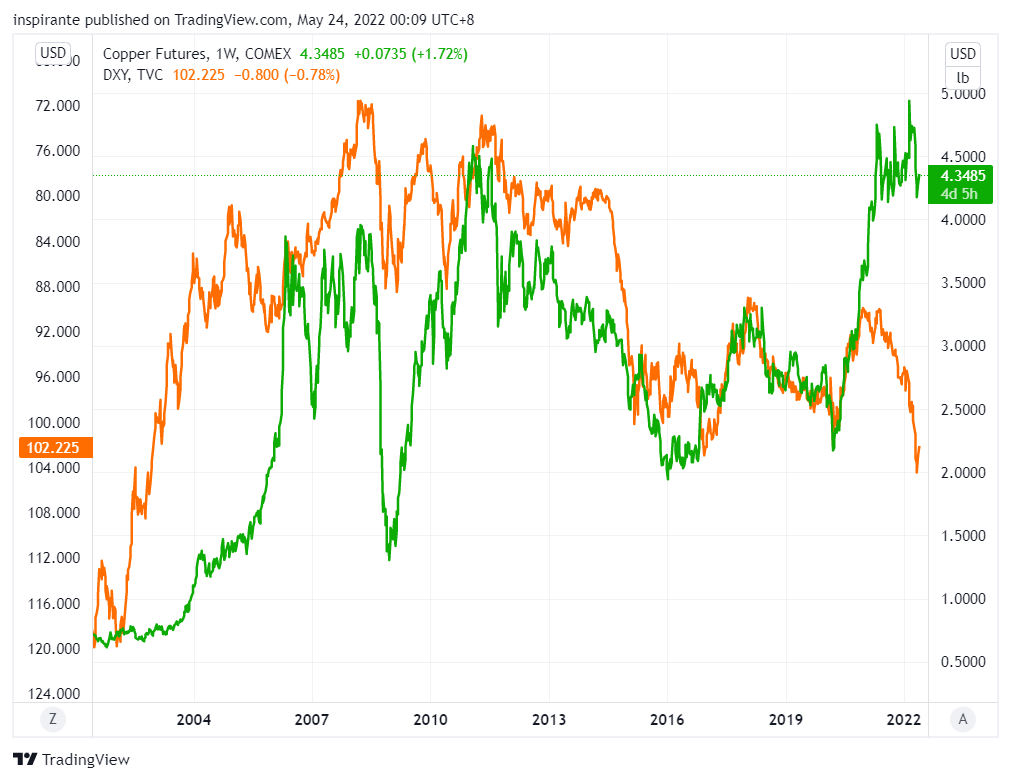
The US Dollar is traditionally inversely correlated to commodity prices, as most of them are quoted in USD. Figure 7 shows the copper price and the inverse of the Dollar Index (DXY). The relationship held well between 2000 and 2019. However, it has broken down post-pandemic, as stronger demand, disrupted production, and supply chain issues pushed the copper price higher, despite a strengthening US Dollar.
Figure 7 Copper vs. DXY
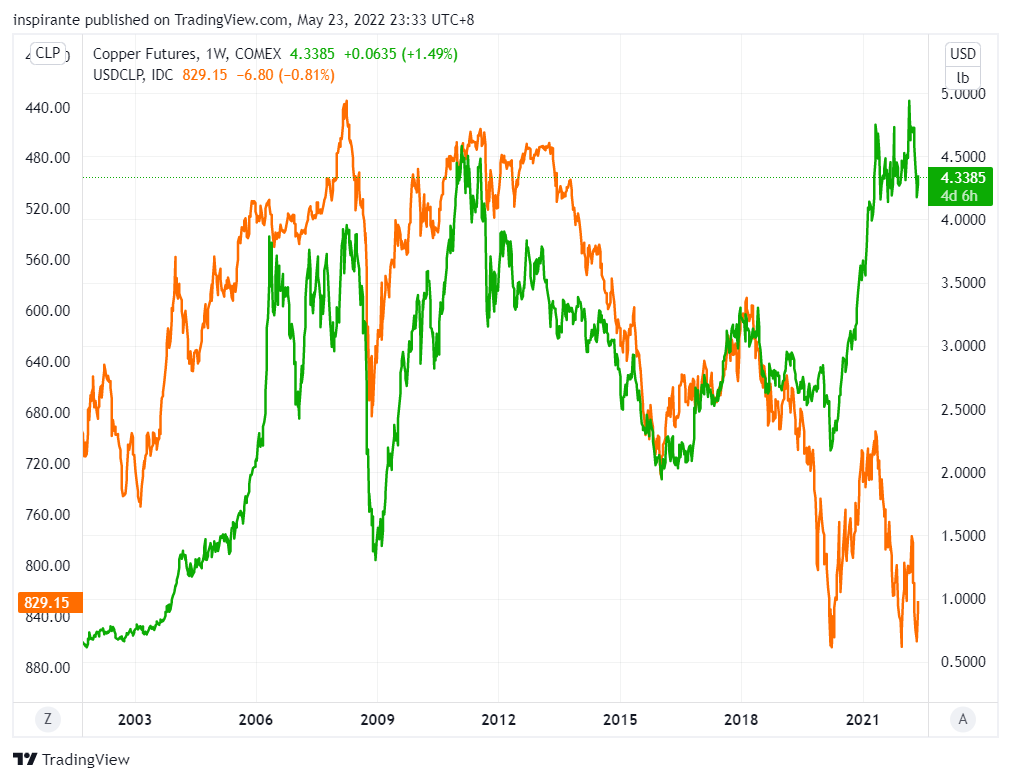
Copper is hugely influenced by the Chinese economy. We can see a near-perfect relationship in recent years between the copper price and USDCNY inversed (Figure 8). The latest sharp depreciation of the Chinese currency against the US Dollar suggests that the copper price still has room to fall if the relationship holds. About 1/3 of the entire world’s copper production comes from Chile, the largest copper producer globally. There is also a big divergence between the copper price and the Chilean Peso exchange rate since 2019 (Figure 9). These two assets are more likely to converge, either by the Chilean Peso appreciation against the US Dollar or by the copper price weakening further.
Figure 8 Copper vs. USDCNY (Inverse)
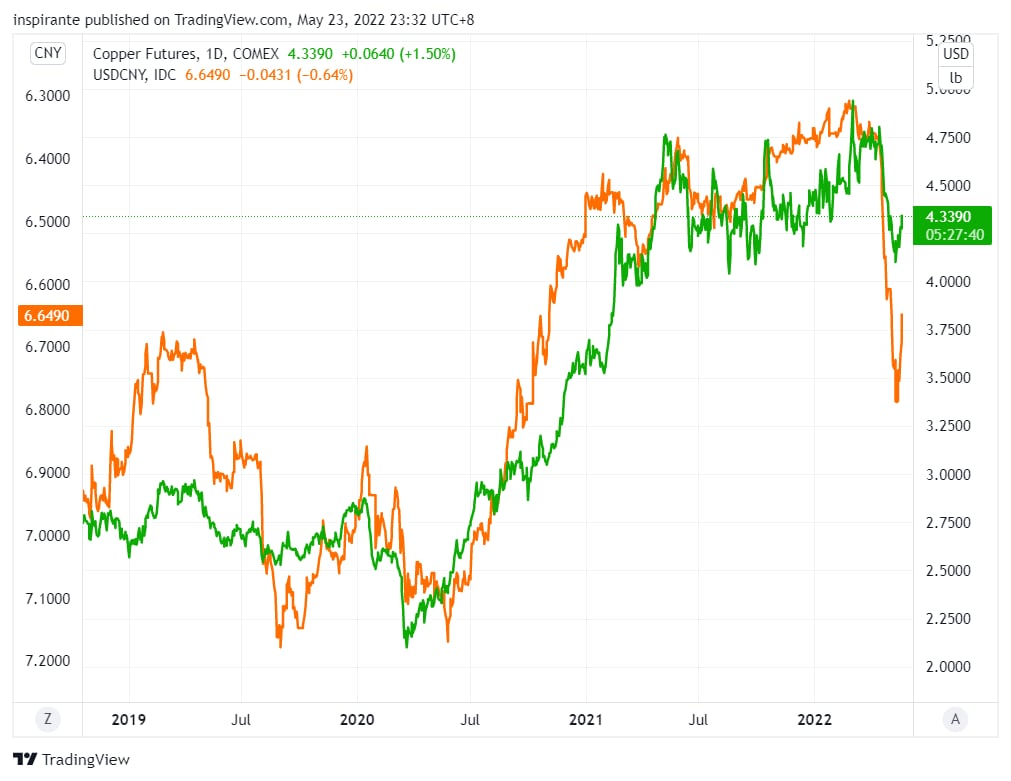
Figure 9 Copper vs. USDCLP (Inverse)
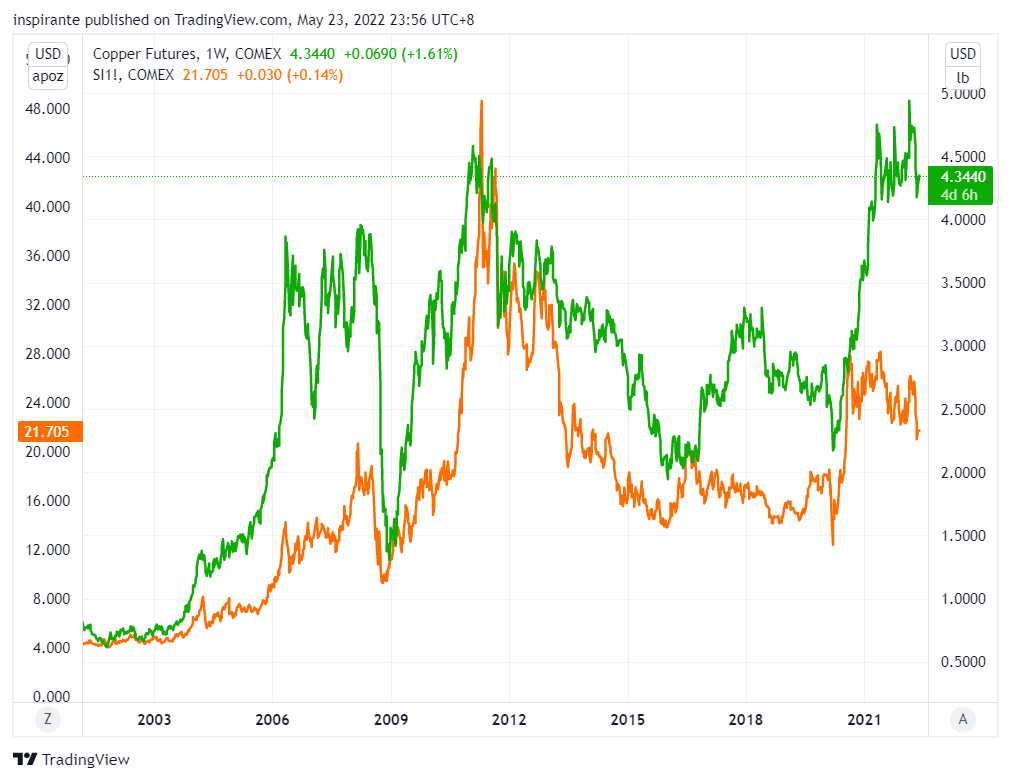
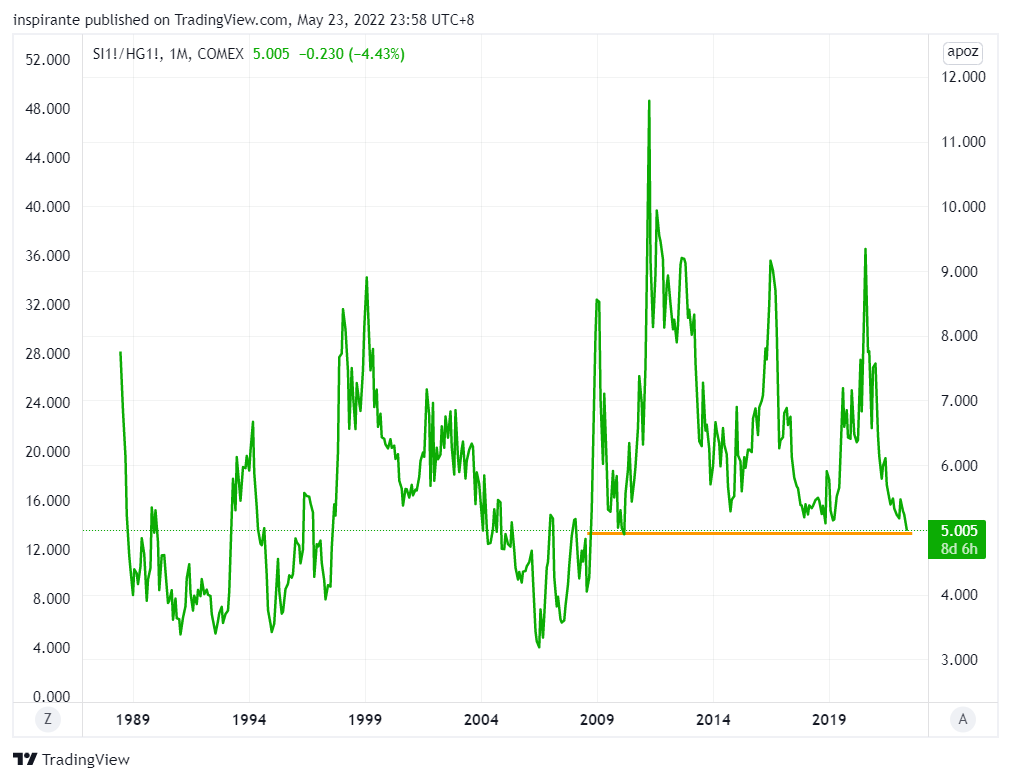
Copper and gold, the most important base metal and precious metal, track each other quite closely in the long run, even though they often diverge at different phases of an economic cycle due to their unique characteristics (Figure 10). Although often categorized as a precious metal like gold, silver also has industrial use, such as in the solar energy industry. Unlike gold, silver has massively underperformed copper since the 2016 low. This is primarily due to the considerably larger demand increase for copper (Figure 11).
Figure 10 Copper vs. Gold
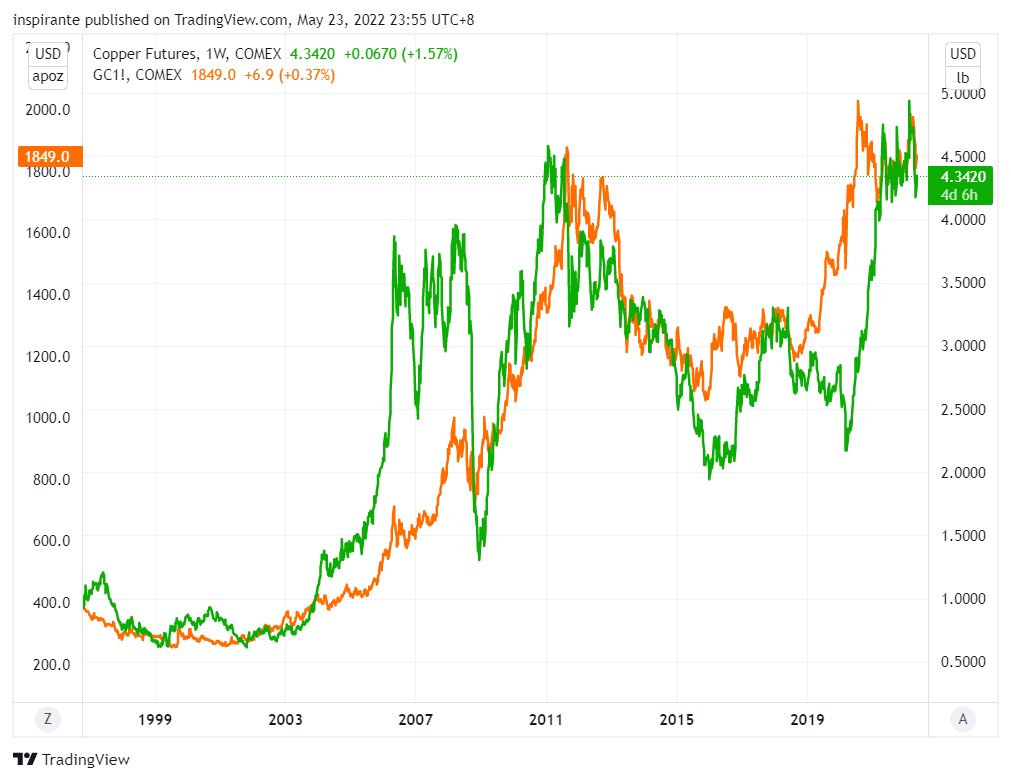
Figure 11 Copper vs. Silver
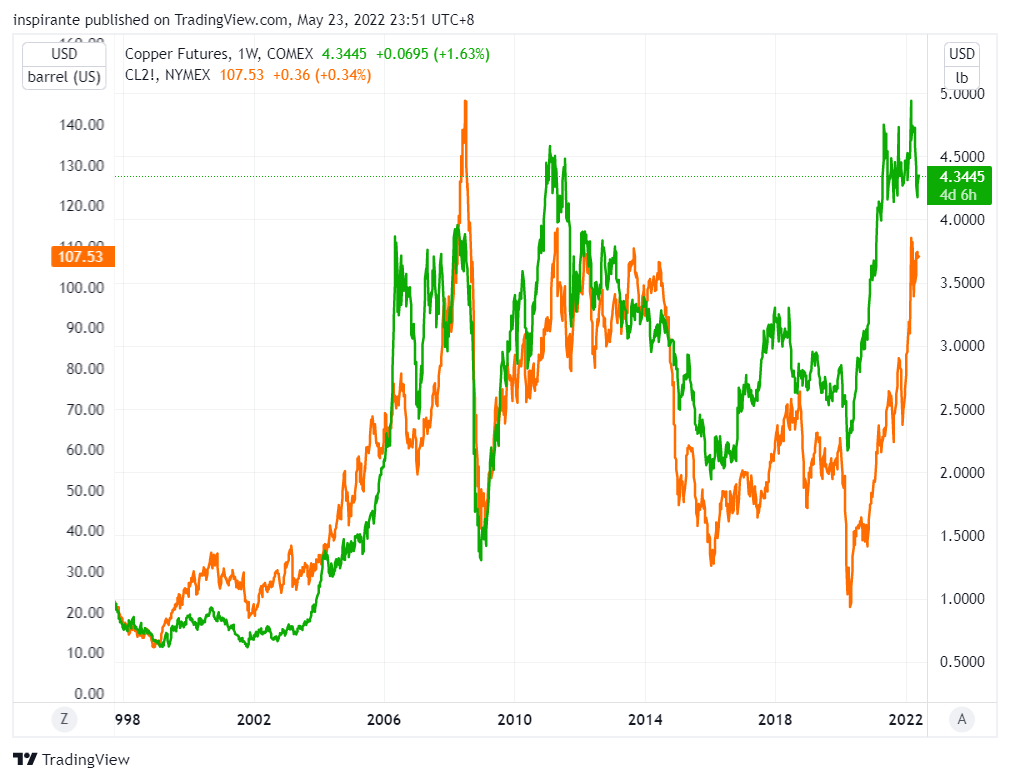
Both copper and crude oil are highly sensitive to the expansion and contraction of global economic activities. Higher fossil fuel prices also lead to higher demand for alternative energy sources, often requiring much more copper for electrification (Figure 12).
Figure 12 Copper vs. WTI Crude Oil
Pair trading opportunities
The ratio between gold and copper has established a clear support level at around 400 since 2012 (Figure 13). In the previous cycles, when the ratio dropped to near 400, it rebounded sharply, as gold began to outperform copper on a relative basis. Similarly, the ratio between silver and copper also has a notable support level at 5.0 since 2009 (Figure 14). If this holds, we could see silver finally catching up and outperforming copper on a relative basis.
Figure 13 Gold/Copper Ratio
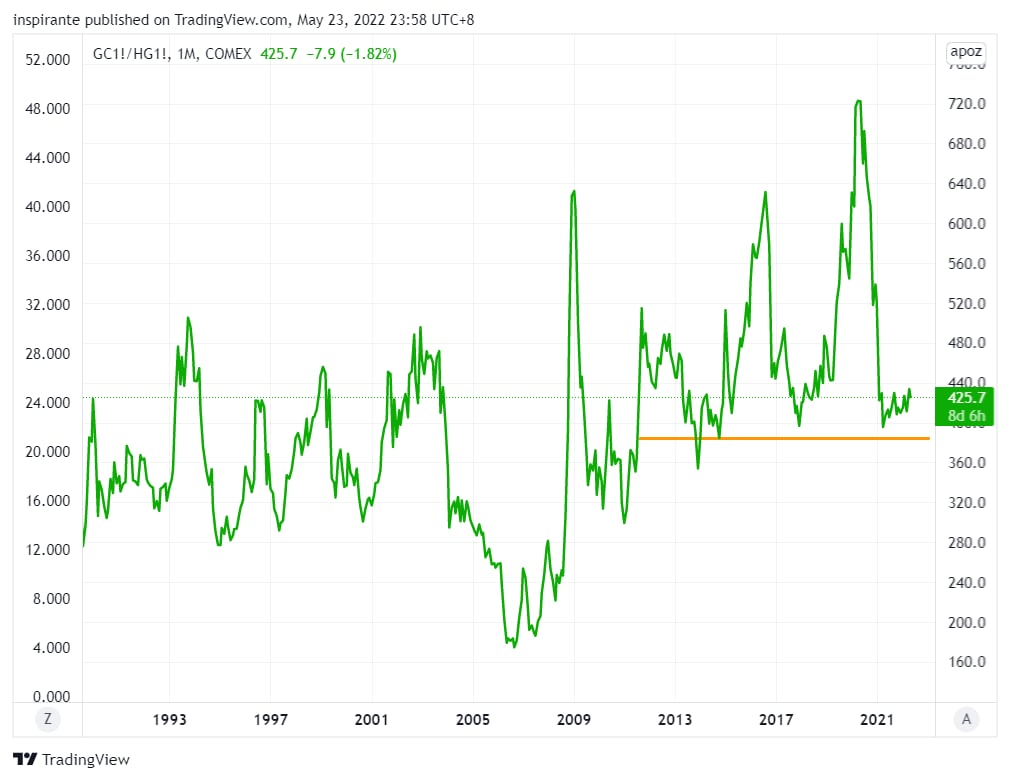
Figure 14 Silver/Copper Ratio
The ratio between crude oil and copper has been trading in a falling wedge since 1999 (Figure 15). The ratio is now at the cusp of breaking out to the upside. If the breakout is confirmed and the ratio continues to head north, we could see crude oil massively outperforming copper.
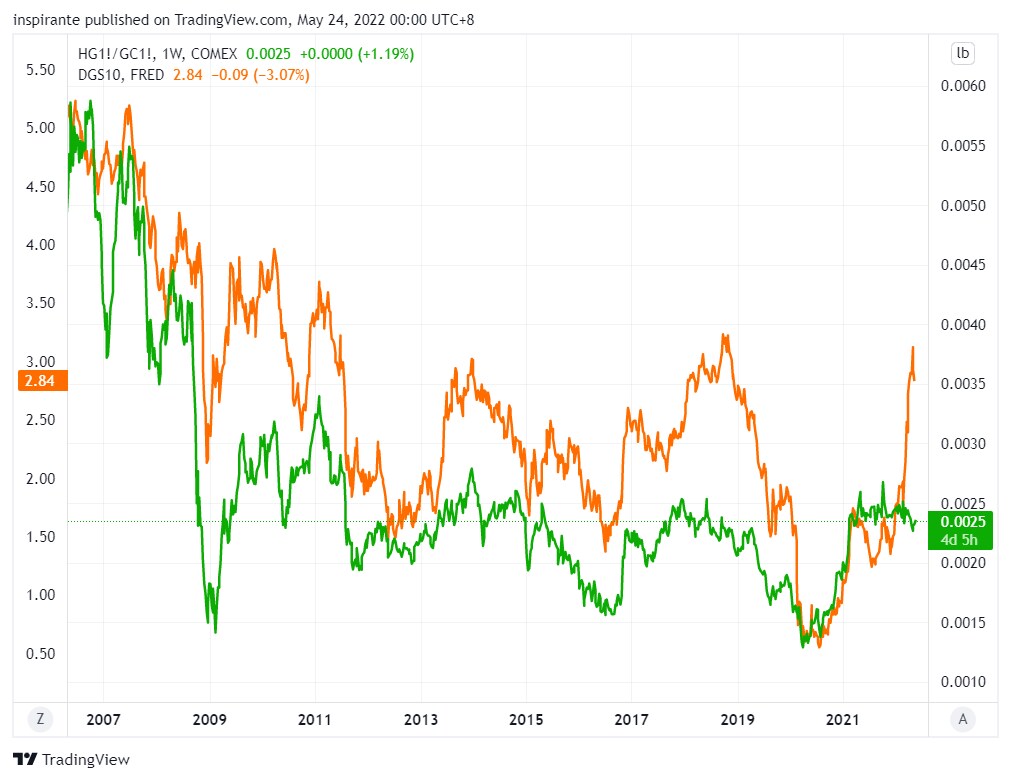
Finally, we compare the copper/gold ratio and the US 10-year treasury yield, which are highly correlated (Figure 16). During an economic expansion, bond yields usually go higher, and copper tends to outperform gold. On the other hand, when the economy is cooling down, and bond yields drop, gold outperforms copper.
The global economy has just experienced one of the fastest recoveries in history, and many countries are now facing high-flying inflation that is getting out of hand. Central banks are stepping hard on the brakes by tightening the financial conditions to curb inflation. Aggressive tightening, however, puts the global economy at the risk of falling into recession, which would lead to lower bond yields and a lower copper/gold ratio.
Figure 15 WTI Crude Oil/Copper Ratio
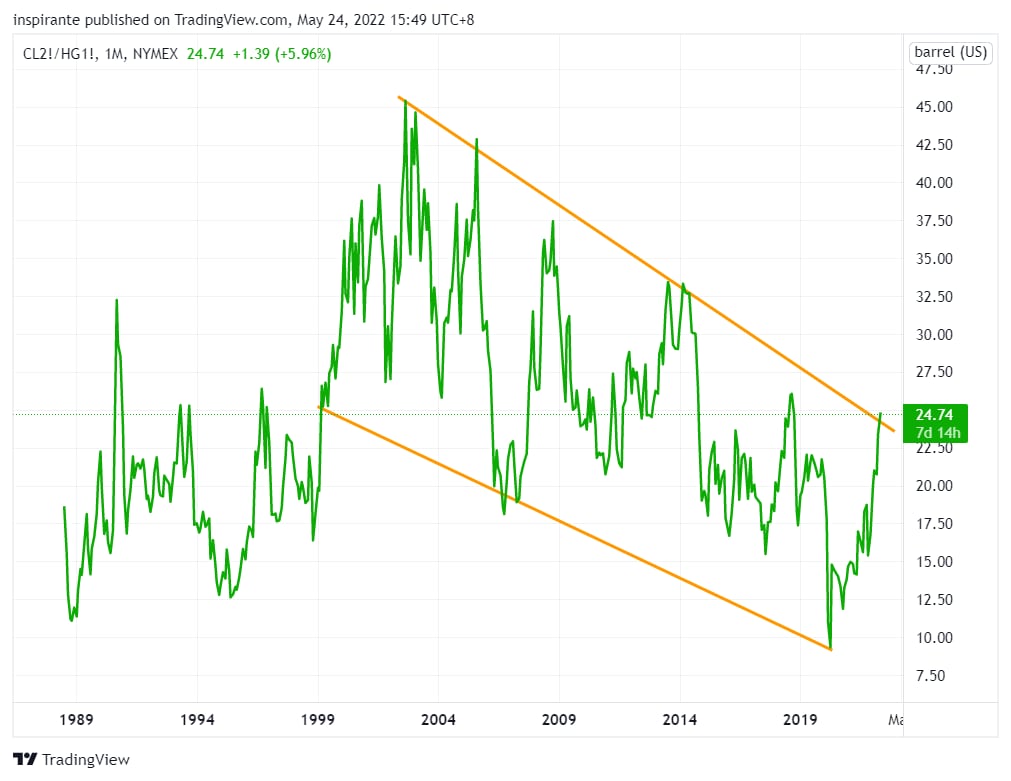
Figure 16 Copper/Gold Ratio vs. US 10-Year Yield
Case Study 5
An advanced investor who is concerned about recessionary risk and holds a bearish short-term view on copper could construct a relative value portfolio to short copper against a basket of commodities, including gold, silver, and crude oil. All three ratio charts in Figures 13, 14, and 15 suggest copper will likely underperform these other commodities, respectively.
For example, the investor could simultaneously buy 1 Micro Gold future (MGCQ2) at 1857 and sell 2 Micro Copper future (MHGN2) at 4.29 with an implied gold/copper ratio of 433. The notional values of the two legs (1857 x 10 = 18570 USD for gold and 4.29 x 2500 x 2 = 21450 USD for copper) are close enough. He could set the stop for the ratio below 350 and the targets at 500 and 650. In addition, the investor would enjoy a margin offset at 40% at the time of writing, which is subject to change depending on volatility and contract size.3
Conclusion
In both investing and trading, the time frame is just as important as the entry and exit. We are very bullish on copper from both fundamental and long-term technical perspectives. We think it still has a long way to go on the upside in the current cycle. However, there are notable short-term headwinds, such as tightening central bank policies and potential recession risk caused by demand destruction. The outlook for copper in the next few months is hence much grimmer.
An investor could tap into different strategies and instruments to be more tactical in the short term while maintaining a bullish bias on copper in the long run.
About the author
Inspirante Trading Solutions Pte Ltd (“ITS”) was incorporated in Singapore in July 2020. Founded by the partners of Synergy Link Capital Pte Ltd (“SLC”) to consolidate their initiatives in FinTech solutions, research, and training programs for different market participants, while SLC continues its focus in proprietary trading. ITS focuses on providing clients bespoke trading solutions such as algo trading systems, risk management systems, research reports, education, and training courses. With a strong technical background, unparalleled understanding, and insights from the actual market practitioners, ITS managed to obtain FinTech certification recognized by the Monetary Authority of Singapore within two months of incorporation. ITS is now actively collaborating with various trading groups, exchanges, and brokers in multiple countries.
The trainers and researchers in ITS have been regularly speaking on various exchange/broker hosted trading seminars and writing for various research publications over the years. Catering to both aspiring and experienced traders, we want to help in bridging the void between the theoretical and practical aspects of derivative trading, with guidance from our team of seasoned and active traders.
Footnote
1 https://www.spglobal.com/commodityinsights/en/market-insights/latest-news/energy-transition/021622-global-light-duty-ev-sales-to-rise-to-268-mil-by-2030-platts-analytics, accessed on 2022-05-24
2 Examples cited in this commentary are for illustration only and shall not be construed as investment recommendations or advice. They serve as an integral part of a case study to demonstrate fundamental concepts in risk management under given market scenarios.
3 https://www.cmegroup.com/markets/metals/precious/gold.margins.html#marginsTab=INTER&pageNumber=1&clearingCode=CX-HG, accessed on 2022-05-24
This post contains sponsored advertising content. This content is for informational purposes only and not intended to be investing advice.
© 2025 Benzinga.com. Benzinga does not provide investment advice. All rights reserved.
Trade confidently with insights and alerts from analyst ratings, free reports and breaking news that affects the stocks you care about.

