


Not to toot my own horn, but I first wrote about the critical 4200 level breakthrough that markets needed to see in order for a bigger move to occur. That article was published May 26th, here's the link:
Will the S&P 500 Break Out of 4200 Level? Charts Suggests Possibility Is Favorable
As of writing the article, on June 6th, the index closed 4283 and seemingly we are close to breaking the 4300 levels soon. Before we go through the charts, what are the top three primary factors driving this rally?
1. Corporate Earnings:
Corporate earnings have generally been strong, surpassing expectations in many cases. As businesses recover and consumer demand rebounds, companies across various sectors are reporting robust financial results. These positive earnings reports are driving investor sentiment and attracting more capital to the stock markets. Just this past earnings season we saw Microsoft MSFT, Apple AAPL Meta Platforms META just to name a few exceeded expectations.
Moreover, technological advancements and innovation continue to play a crucial role in market growth. Companies at the forefront of technology, such as those in the digital transformation, e-commerce, and renewable energy sectors, are experiencing significant growth and attracting investor attention.
2. Moderating Inflation
Inflation is a persistent rise in the general level of prices in an economy over a sustained period. It is a complex economic phenomenon that can have significant effects on businesses, consumers, and overall economic stability. Understanding the causes of inflation is crucial for policymakers, investors, and individuals alike. We have seen a significant downturn in headline CPI data for the last 12 months:

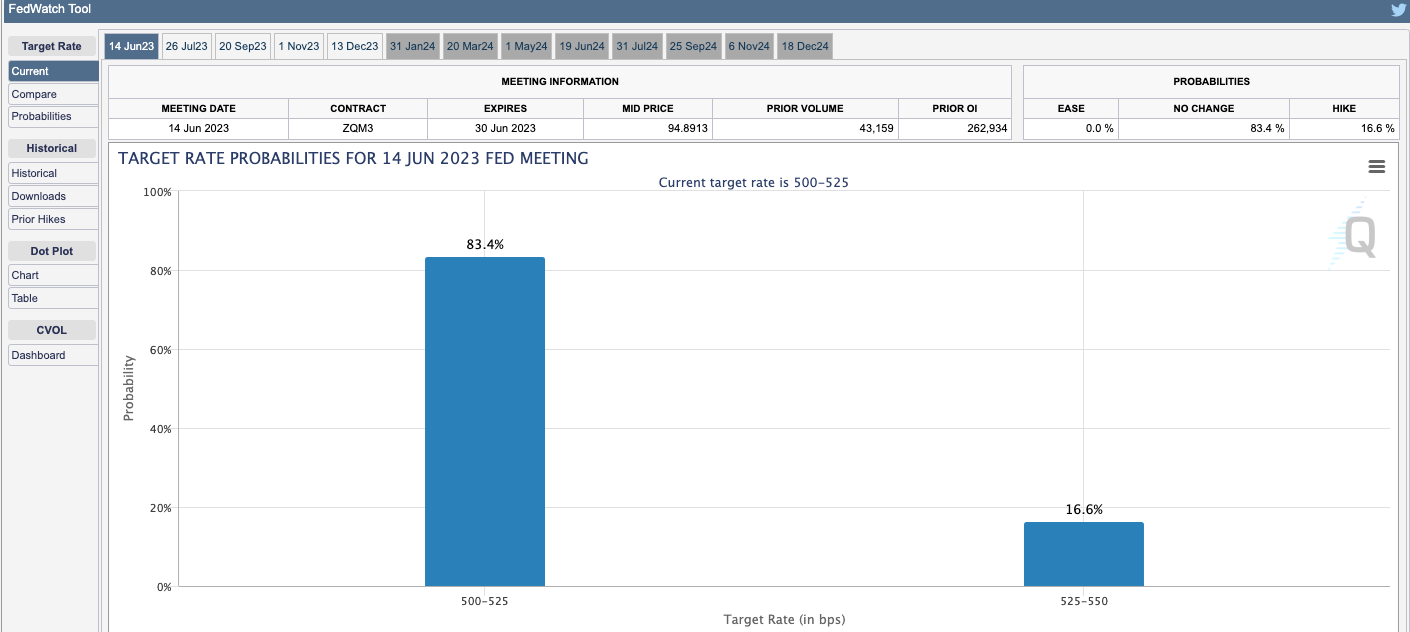
3. Markets Pricing In Rate Pause & High Employment
One primary objective of the Fed is to maintain price stability. If inflationary pressures are rising and there is a concern that prices may accelerate beyond the desired target, the Fed may opt to raise interest rates. By increasing rates, borrowing becomes more expensive, which can moderate spending and dampen inflationary pressures. The Feds also monitors the labor market closely. If employment levels reach or exceed full employment, where the majority of individuals who want jobs have them, the Fed may consider raising rates to prevent the economy from overheating. Higher interest rates can help prevent excessive wage growth and maintain a stable labor market. Lastly, Feds is responsible for promoting the stability of the financial system. If there are concerns about excessive risk-taking, speculative bubbles, or imbalances in the financial markets, the Fed may increase interest rates as a precautionary measure.
It's expected as of today, there will be a 83% chance of the Feds pausing rate hikes at least for June FOMC:
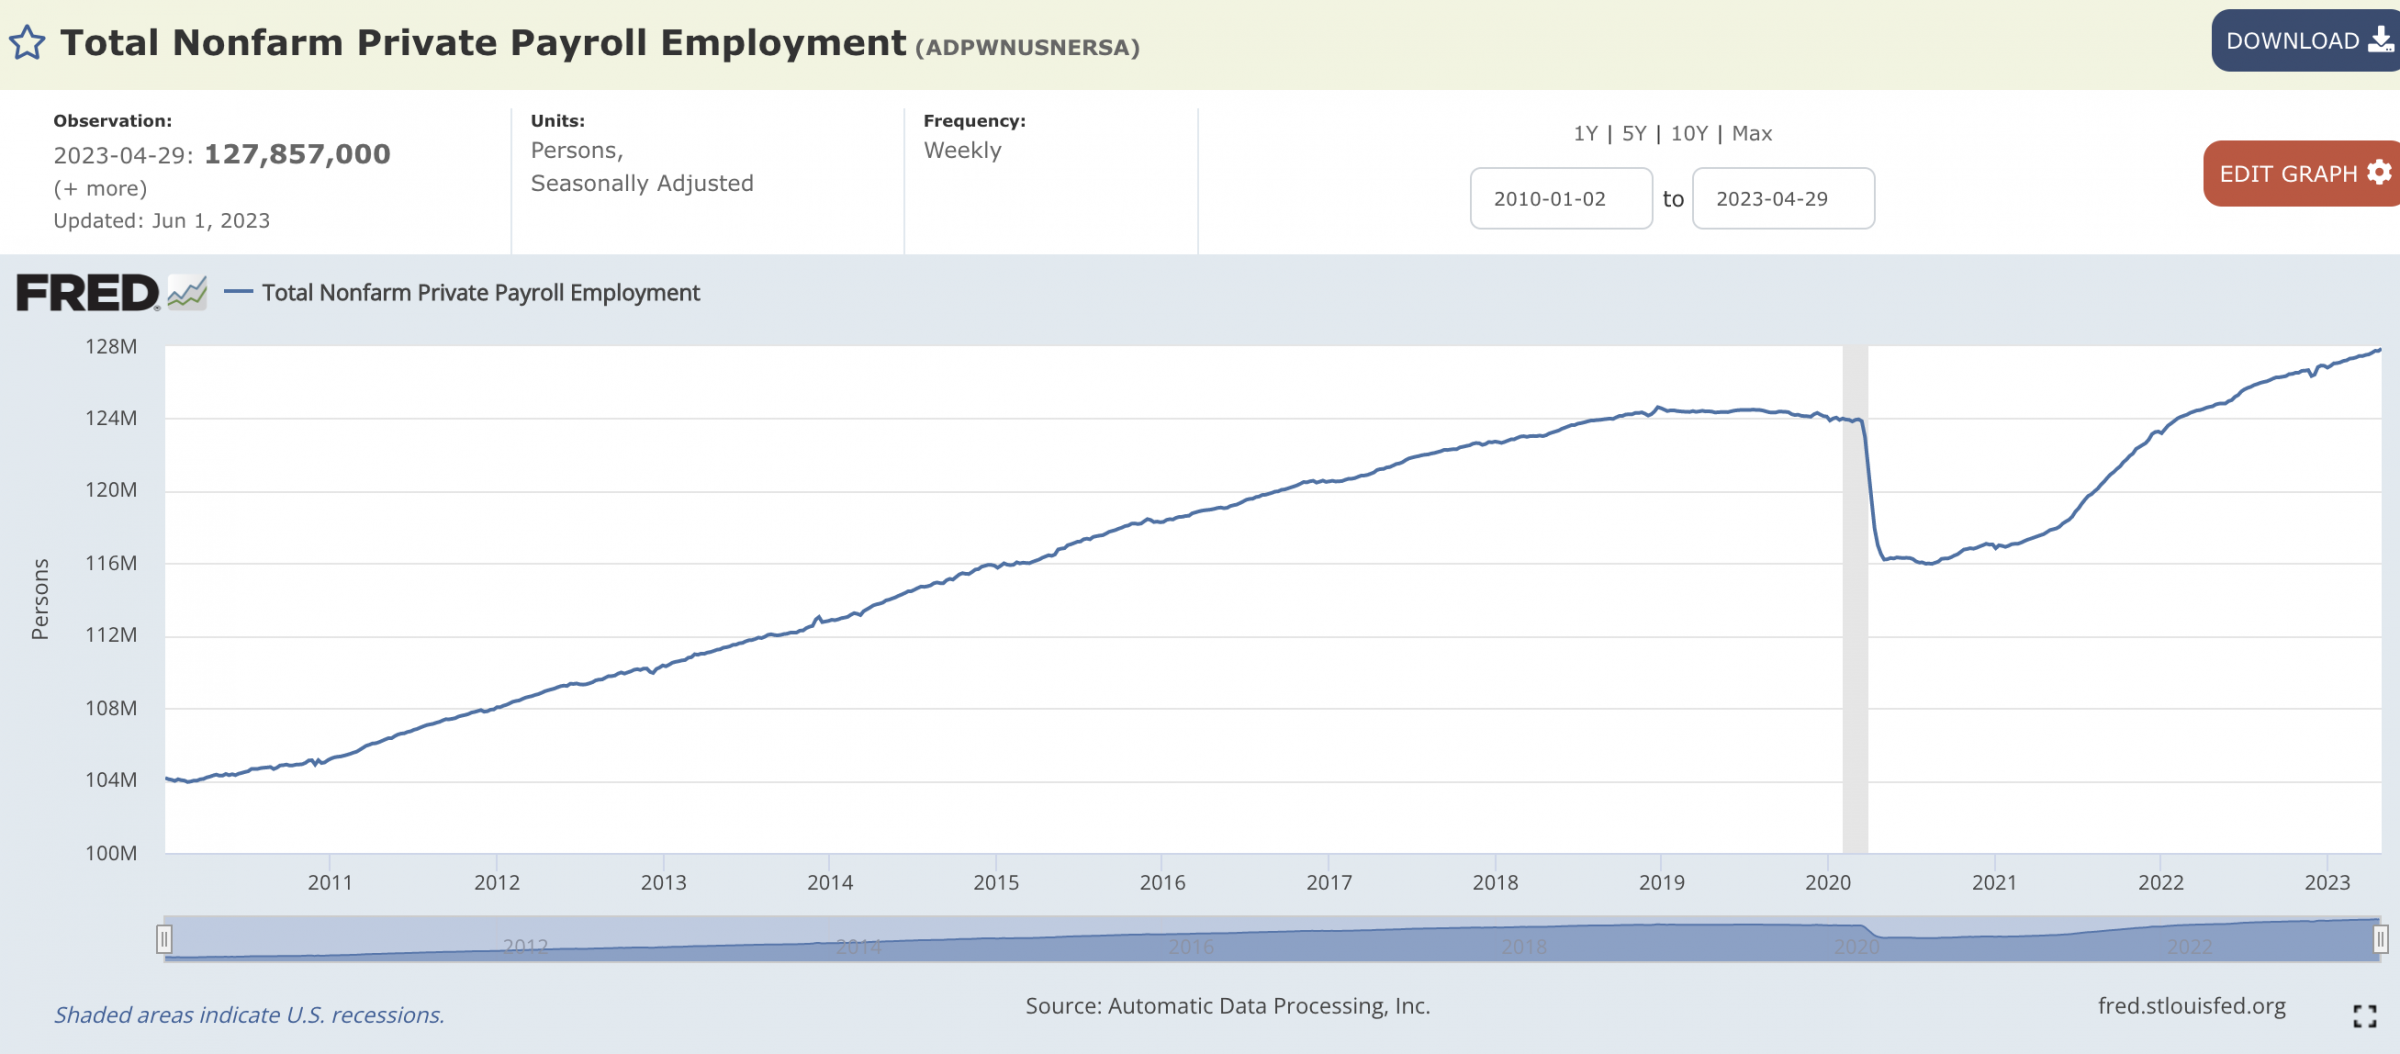
Lastly, if we view the trend on Employment since Covid, it is even more clear to see why the market is breaking through resistances:
Now, on to the charts dated end of day June 6th, 2023.
Daily Timeframe:
Green Line: 200DMA Yellow: 50DMA Orange: 20DMA
Contructive to say the least for number of reasons. The daily MACD oscillator has truned green over the last several days and the momentum seems toe carry over last serveral days even after blowing past 4200. My short term (end of summer) target is little under 4400, which corresponds with a trendline in WHITE below from October Lows. Likely pull backs will come, as long as index stays above the 20D (4178), we are still in an uptrend. A break down of the 20DMA I expect 50DMA to hold 4134.

Weekly Timeframe:
While I am bullish for the summer, I'm looking for some backtest of weekly 20DMA in orange at 4101. Why? So far this week, we are trading in a very tight range. We'll have to assess again at week's end. However, starting to run out of steam if we cannot close above 4300 this week. If we do, our summer end's target of 4400 is in view.

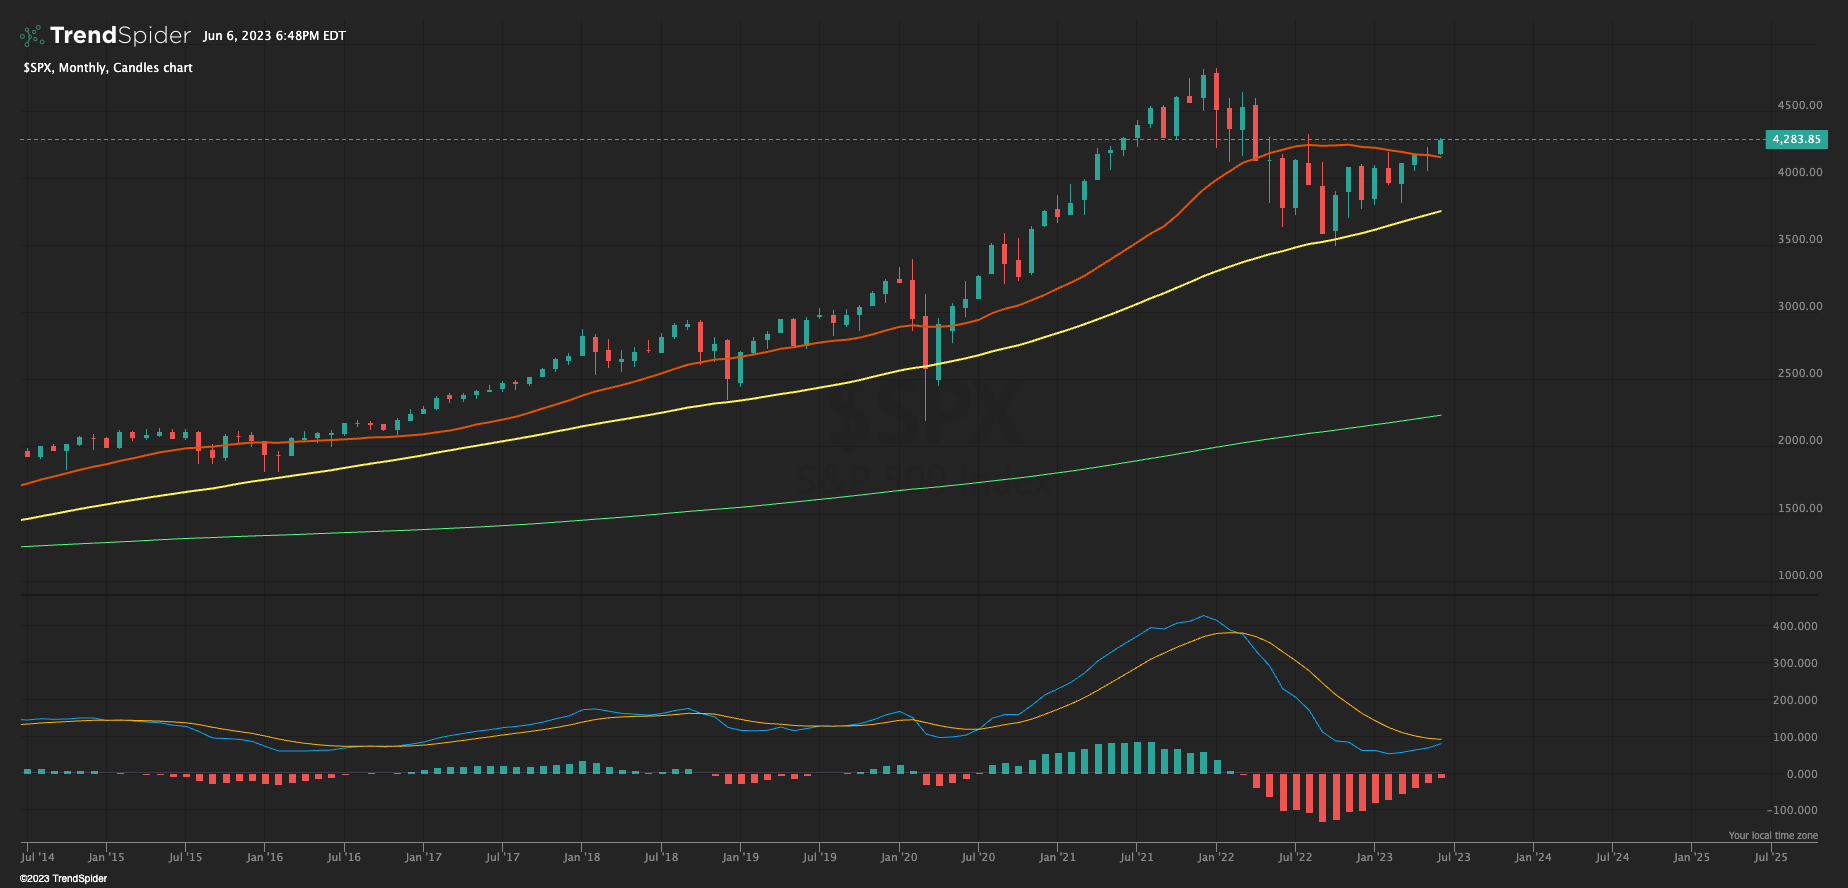
Monthly Timeframe:
Perhaps the most bullish timeframe is the index monthly chart. For one, MACD is flipping cross 0 line. We closed the month of May above the 20MA which was critical for me personally to see a susutained uptrend. If you look back to the 20DMA April 2020, that was the month the index closed above the 20MA. Subsequently we saw one of history's greatest bullrun! As of this writing, monthly candle tested the 20MA and showing strength. Long month to go as market awaits next round of CPI Data, and FOMC rate decision.
For more trading signals, education, visit www.therocktradingco.com or sign up for our newsletter here.
Edge Rankings
Price Trend
© 2025 Benzinga.com. Benzinga does not provide investment advice. All rights reserved.
Trade confidently with insights and alerts from analyst ratings, free reports and breaking news that affects the stocks you care about.

