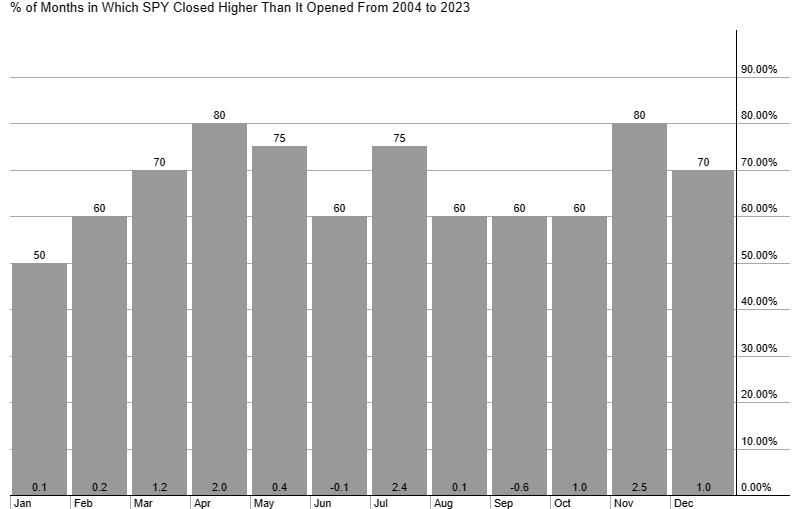
April is a great month for major indices like the S&P 500 and NYSE Composite. Slightly less so for the Nasdaq 100, but still decent. Over the last 20 years, April ranks as one of the best three months of the year.
Between 2004 and 2023 (April hasn't occurred yet in 2024), the S&P 500 has closed higher than it opened in April 16 out of 20 times (80%). The average gain for the month is 2%.
The NYSE Composite, a more diversified basket of stocks because it includes companies of varying sizes from many different industries, has the same stats. It has moved higher in 16 of the last 20 Aprils and the average gain is 2%.
For Nasdaq 100 performance, it has an average gain of 2% in April, but has only moved higher in 13 out of the last 20 Aprils (65%).
Other top months of the year for the S&P 500 are:
- July: Moves higher 75% of the time with an average gain of 2.4%.
- November: Increases 80% of the time, average gain of 2.5%.
The following chart courtesy of StockCharts.com shows how the SPDR S&P 500 ETF SPY has performed in each month between 2004 and 2023. The number at the top of the column is how often the price has closed higher than it opened (percent). The bottom of the column is the average gain or loss for the month over the 20 years.

Seasonality, how assets perform at different times in the year, tells us what has happened in the past. It may not accurately predict what will happen in the future. Each year there are different circumstances affecting the stock market.
As April approaches, the NYSE Composite, S&P 500, and Nasdaq 100 have been in uptrends since late-2023. The Nasdaq 100 has slowed in March, moving sideways, yet the overall bull market remains intact.
April could be great for the major indices again, continuing the trend of the last several months. Or this could be one of the months where April declines.
Always manage risk on positions. Watch for breaks below prior swing lows to indicate the uptrend could be faltering. Disclaimer: The author owns S&P 500 and Nasdaq 100 ETFs in a long-term passive investing portfolio.
This article is from an unpaid external contributor. It does not represent Benzinga's reporting and has not been edited for content or accuracy.
© 2025 Benzinga.com. Benzinga does not provide investment advice. All rights reserved.
Trade confidently with insights and alerts from analyst ratings, free reports and breaking news that affects the stocks you care about.