What to expect for July 15 - July 19, 2024
Weekly Wrap-Up
During the week of July 8 through July 12, 2024, the U.S. financial markets experienced a range of developments that impacted various sectors. Major indices, including the Dow Jones Industrial Average, the S&P 500, and the Nasdaq Composite, continued to show resilience and reached record highs or near-record levels, driven by a combination of positive economic data and investor sentiment.
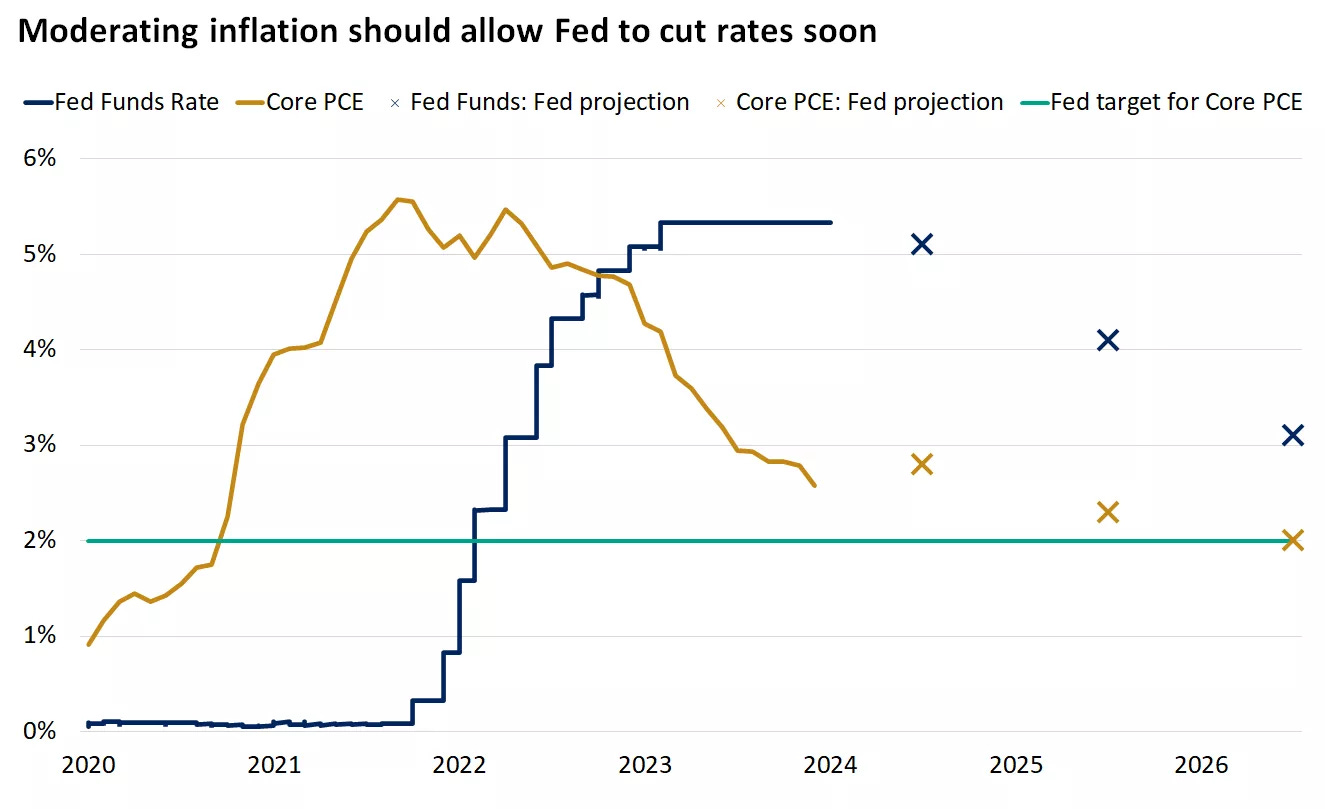
The Dow Jones Industrial Average rose by almost 2%, nearing its record high of 40,003.6 points set two months earlier. The S&P 500 and the Nasdaq Composite posted fractional gains, underscoring the ongoing bullish sentiment in the market. This optimism was fueled by a better-than-expected inflation report released on Thursday, which indicated that the Consumer Price Index (CPI) had slipped by 0.1% from May to June. This marked the first month-to-month drop in inflation since May 2020 and brought the annual inflation rate down to 3.0% from 3.3% in the previous month. However, a separate report on Friday showed a larger-than-expected rise in wholesale prices, adding some uncertainty to the inflation outlook.
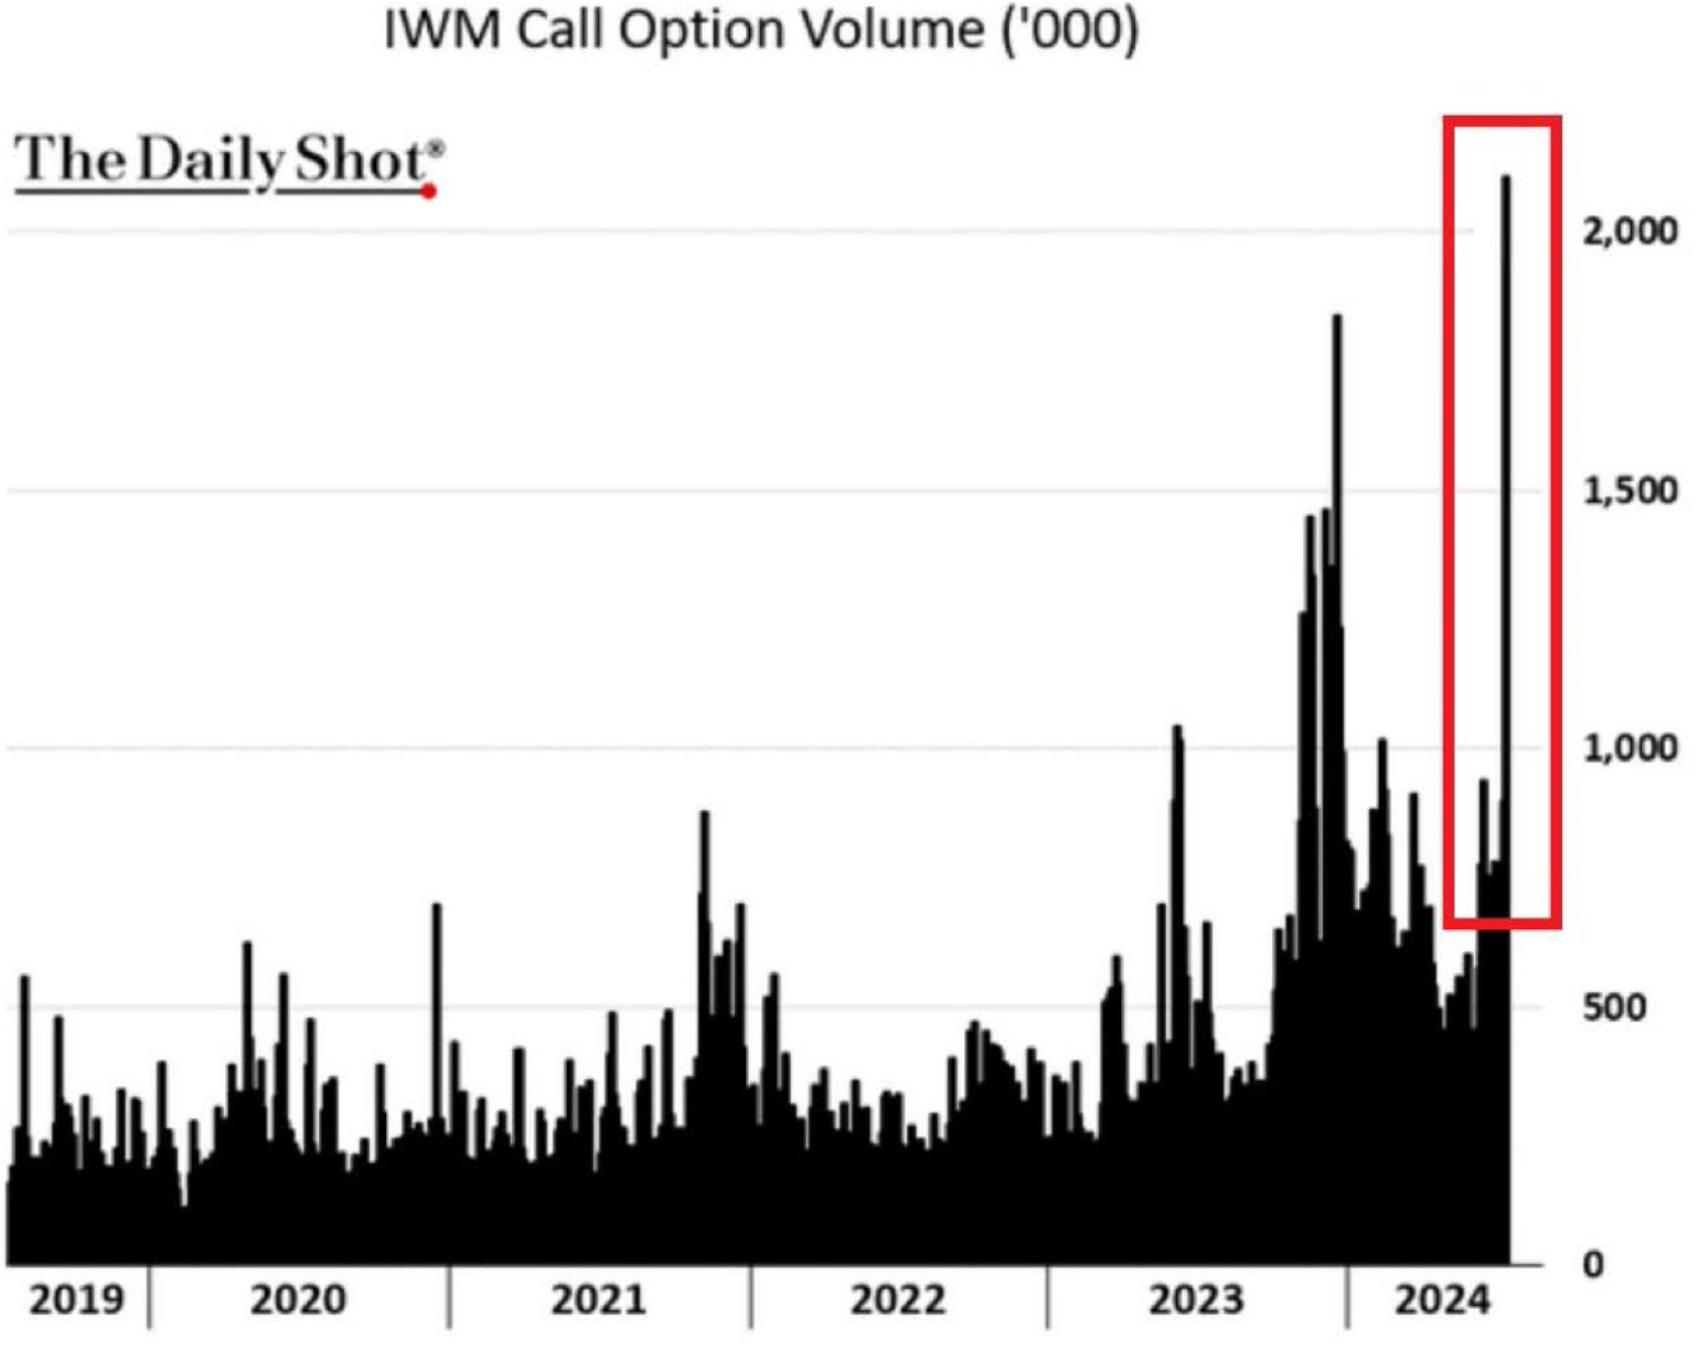
Small-cap stocks saw a significant surge, with the Russell 2000 Index posting a 6.0% total return for the week, its highest level since January 2022. Despite this strong performance, the Russell 2000 continued to lag behind its large-cap peers on a year-to-date basis, highlighting the ongoing divergence between small-cap and large-cap stocks
.
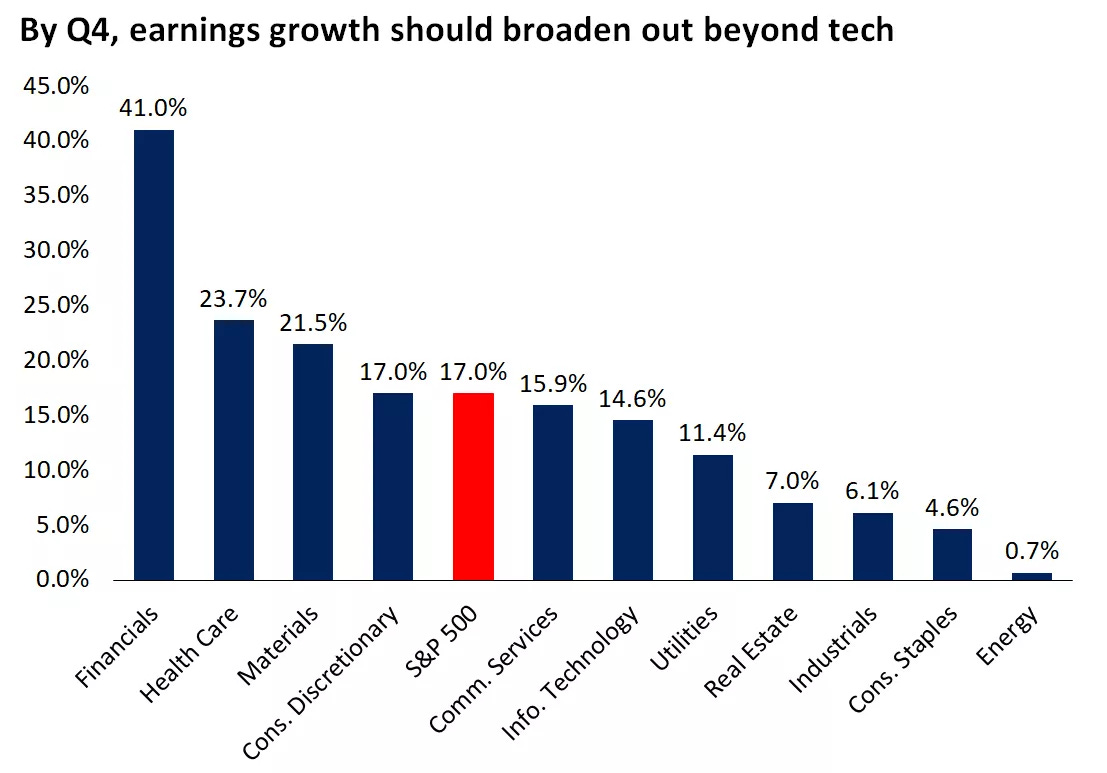
The week also marked the beginning of the earnings season, with mixed results from three major U.S. banks reporting their second-quarter numbers. Two of the banks reported year-over-year declines in earnings, reflecting the challenges faced by the financial sector. Entering the earnings season, analysts had forecasted an overall earnings growth of 8.9% for the S&P 500 compared to the previous year’s second quarter, the strongest quarterly growth rate in over two years.
A notable development during the week was the outperformance of U.S. large-cap value stocks compared to their growth counterparts. A large-cap value index posted a 2.8% total return, while the growth index slipped by 0.4%, eroding some of the growth style’s year-to-date outperformance. This shift in investor preference indicated a rotation into more defensive and value-oriented sectors amid concerns about economic growth and inflation.
Government bond yields declined significantly over the week, as investors interpreted the inflation report as a sign that interest-rate cuts could be on the horizon. The yield on the 10-year U.S. Treasury bond fell to 4.18% at Friday's close, the lowest in nearly four months. Yields on 2- and 30-year notes also declined, reflecting broader expectations of easing monetary policy.
Consumer sentiment showed signs of weakness, with the University of Michigan’s Consumer Sentiment Index dropping to its lowest level in eight months. Despite this decline, the survey found some improvement in consumers’ inflation expectations for the second consecutive month, providing a mixed picture of consumer confidence.
The retail sector remained a focal point, with anticipation building for the scheduled release of U.S. retail sales data. In May, retail sales had risen by 0.1% month-over-month after a 0.2% decline in April, both figures showing a sharp drop from the gains recorded in the earlier months of the year. The upcoming data was expected to provide further insights into the state of consumer spending and economic activity.
In summary, the week of July 8 through July 12, 2024, was marked by a combination of record highs in major stock indices, significant gains in small-cap stocks, mixed earnings reports, a notable shift in investor preference towards value stocks, declining bond yields, and weakening consumer sentiment. The inflation report played a crucial role in shaping market expectations for future interest-rate cuts, while the beginning of the earnings season provided a glimpse into the financial health of major corporations. Investors remained focused on upcoming economic data and the potential implications for monetary policy, navigating a complex landscape of economic indicators and market dynamics.
Institutional Dollar Index for Major Indices
The Institutional Dollar Index (IDI) expresses institutional volume as a percent of total daily volume by day. High values mean large institutional involvement and may suggest a directional commitment by larger players; low values mean low institutional involvement and suggest a continuation of current conditions. Like all institutional flow we look at, the direction can’t be known by this data itself; what is most important is the subsequent reaction to liquidity when it shows relatively high readings.
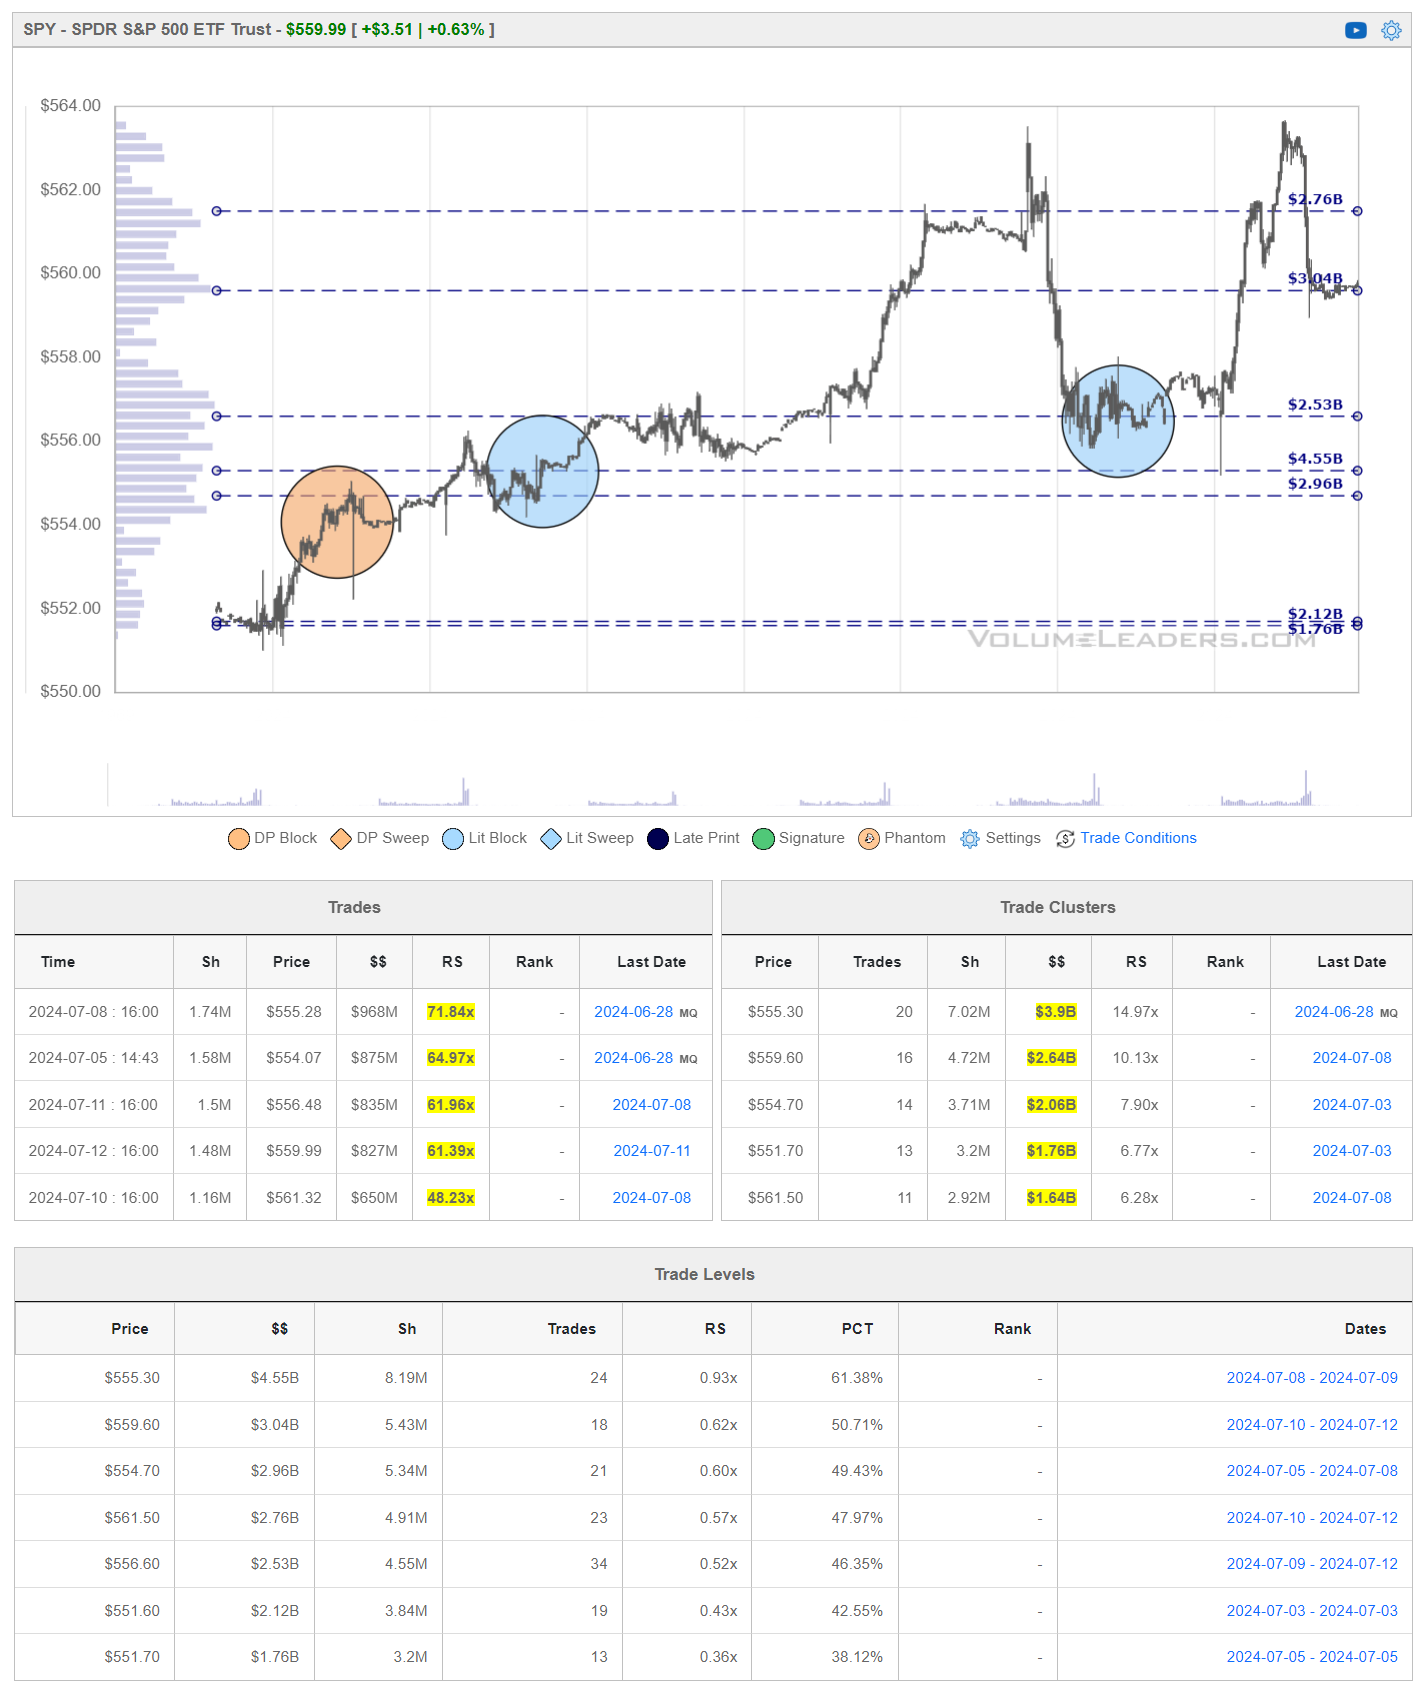
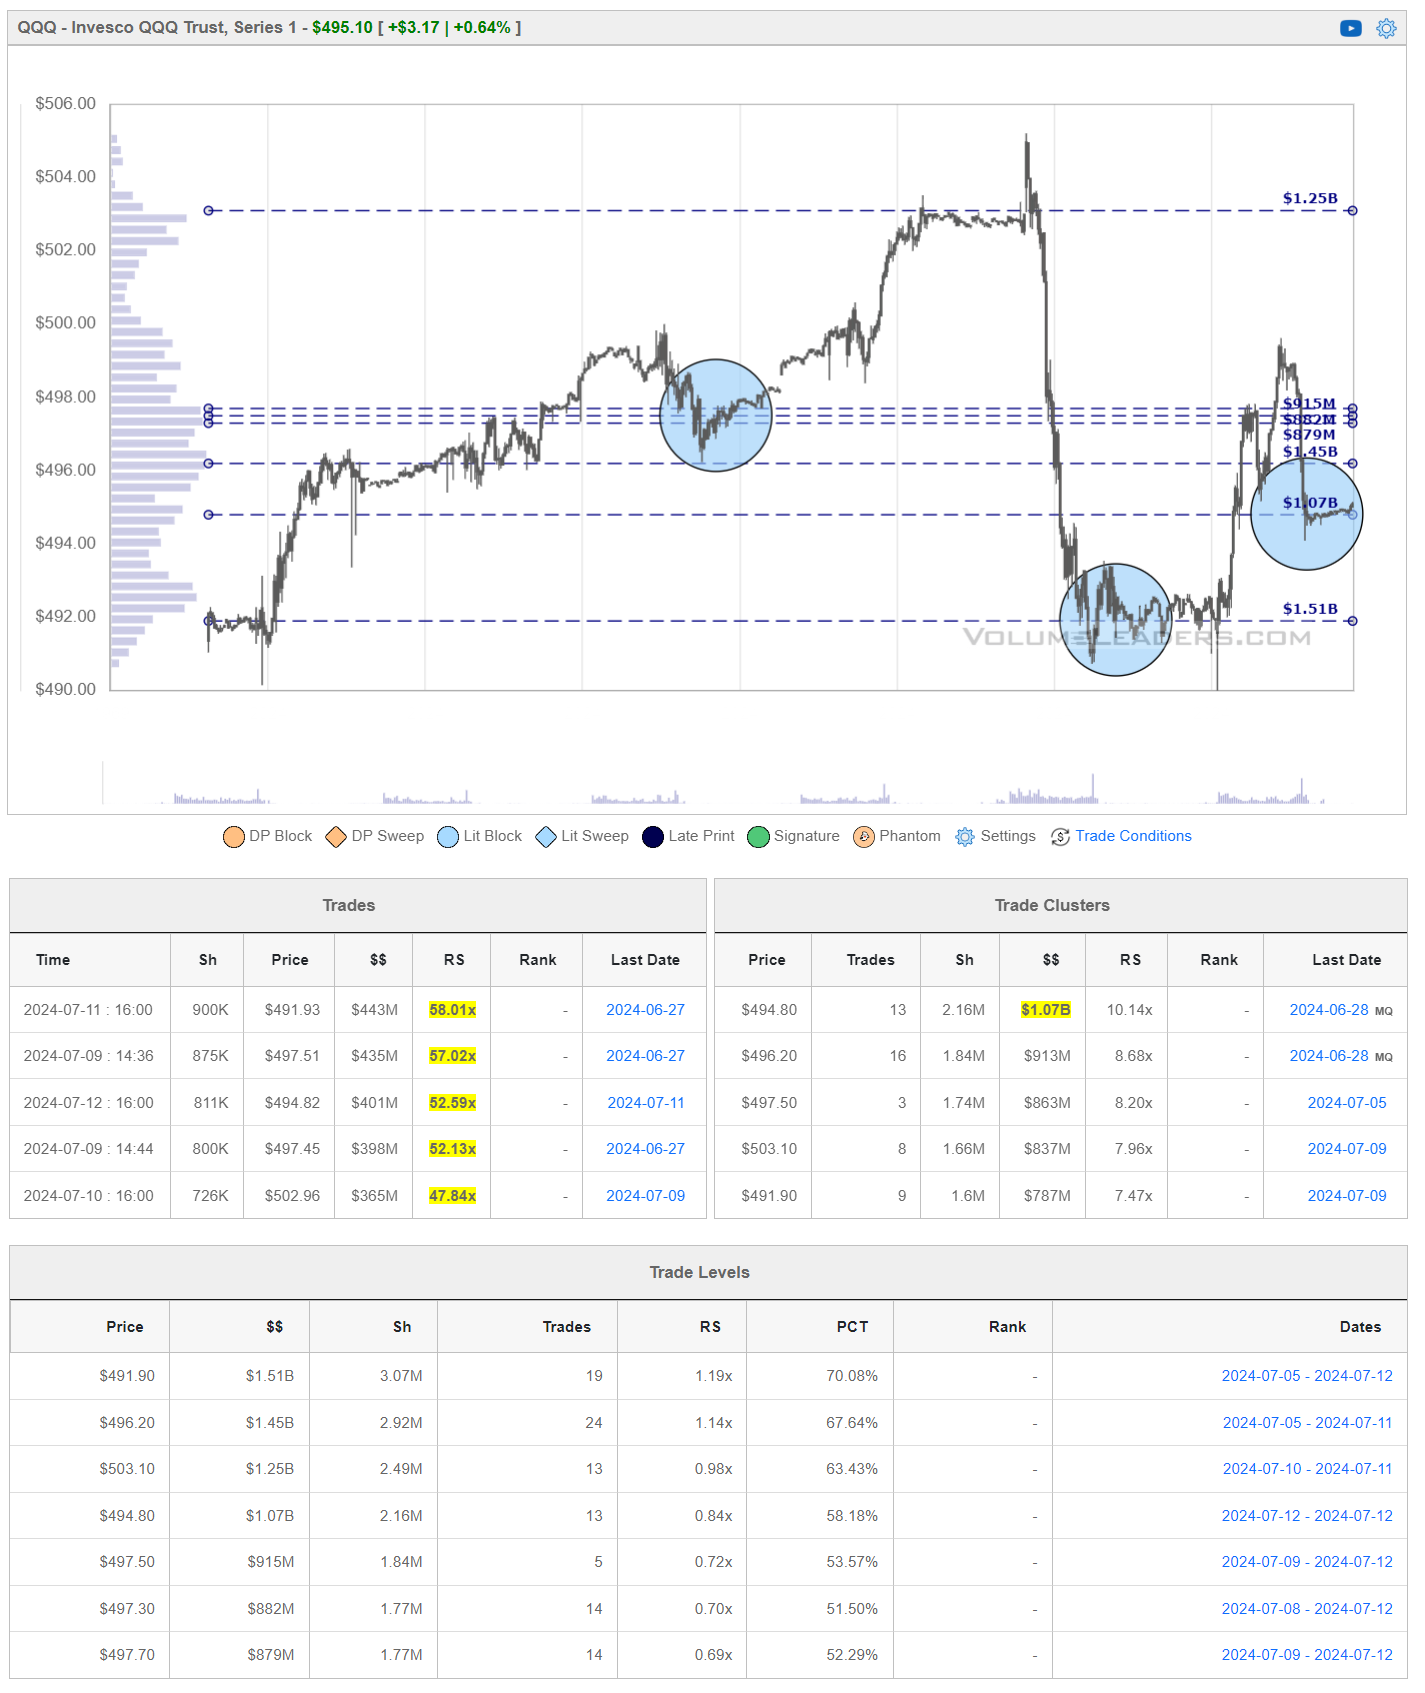
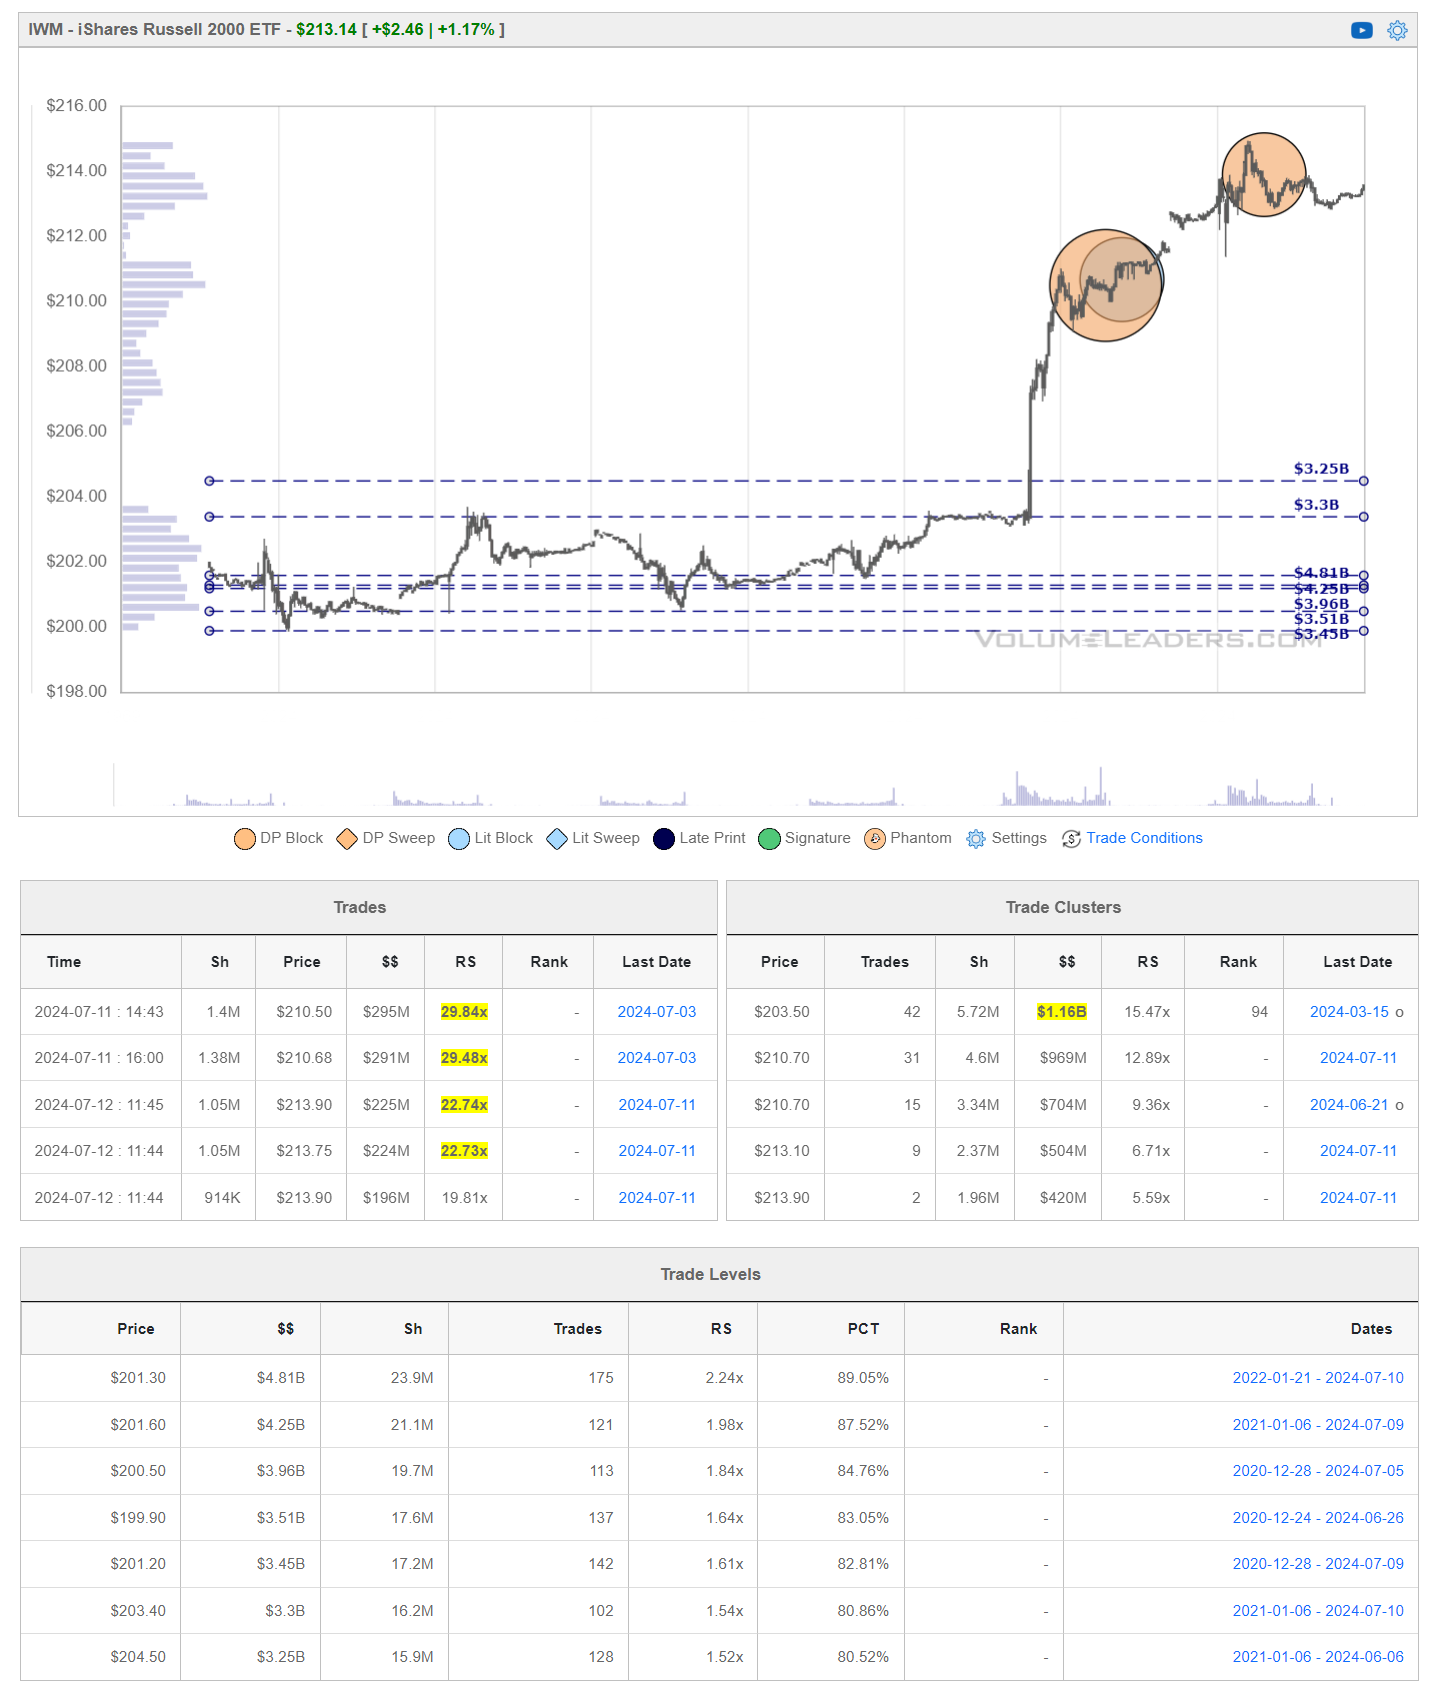
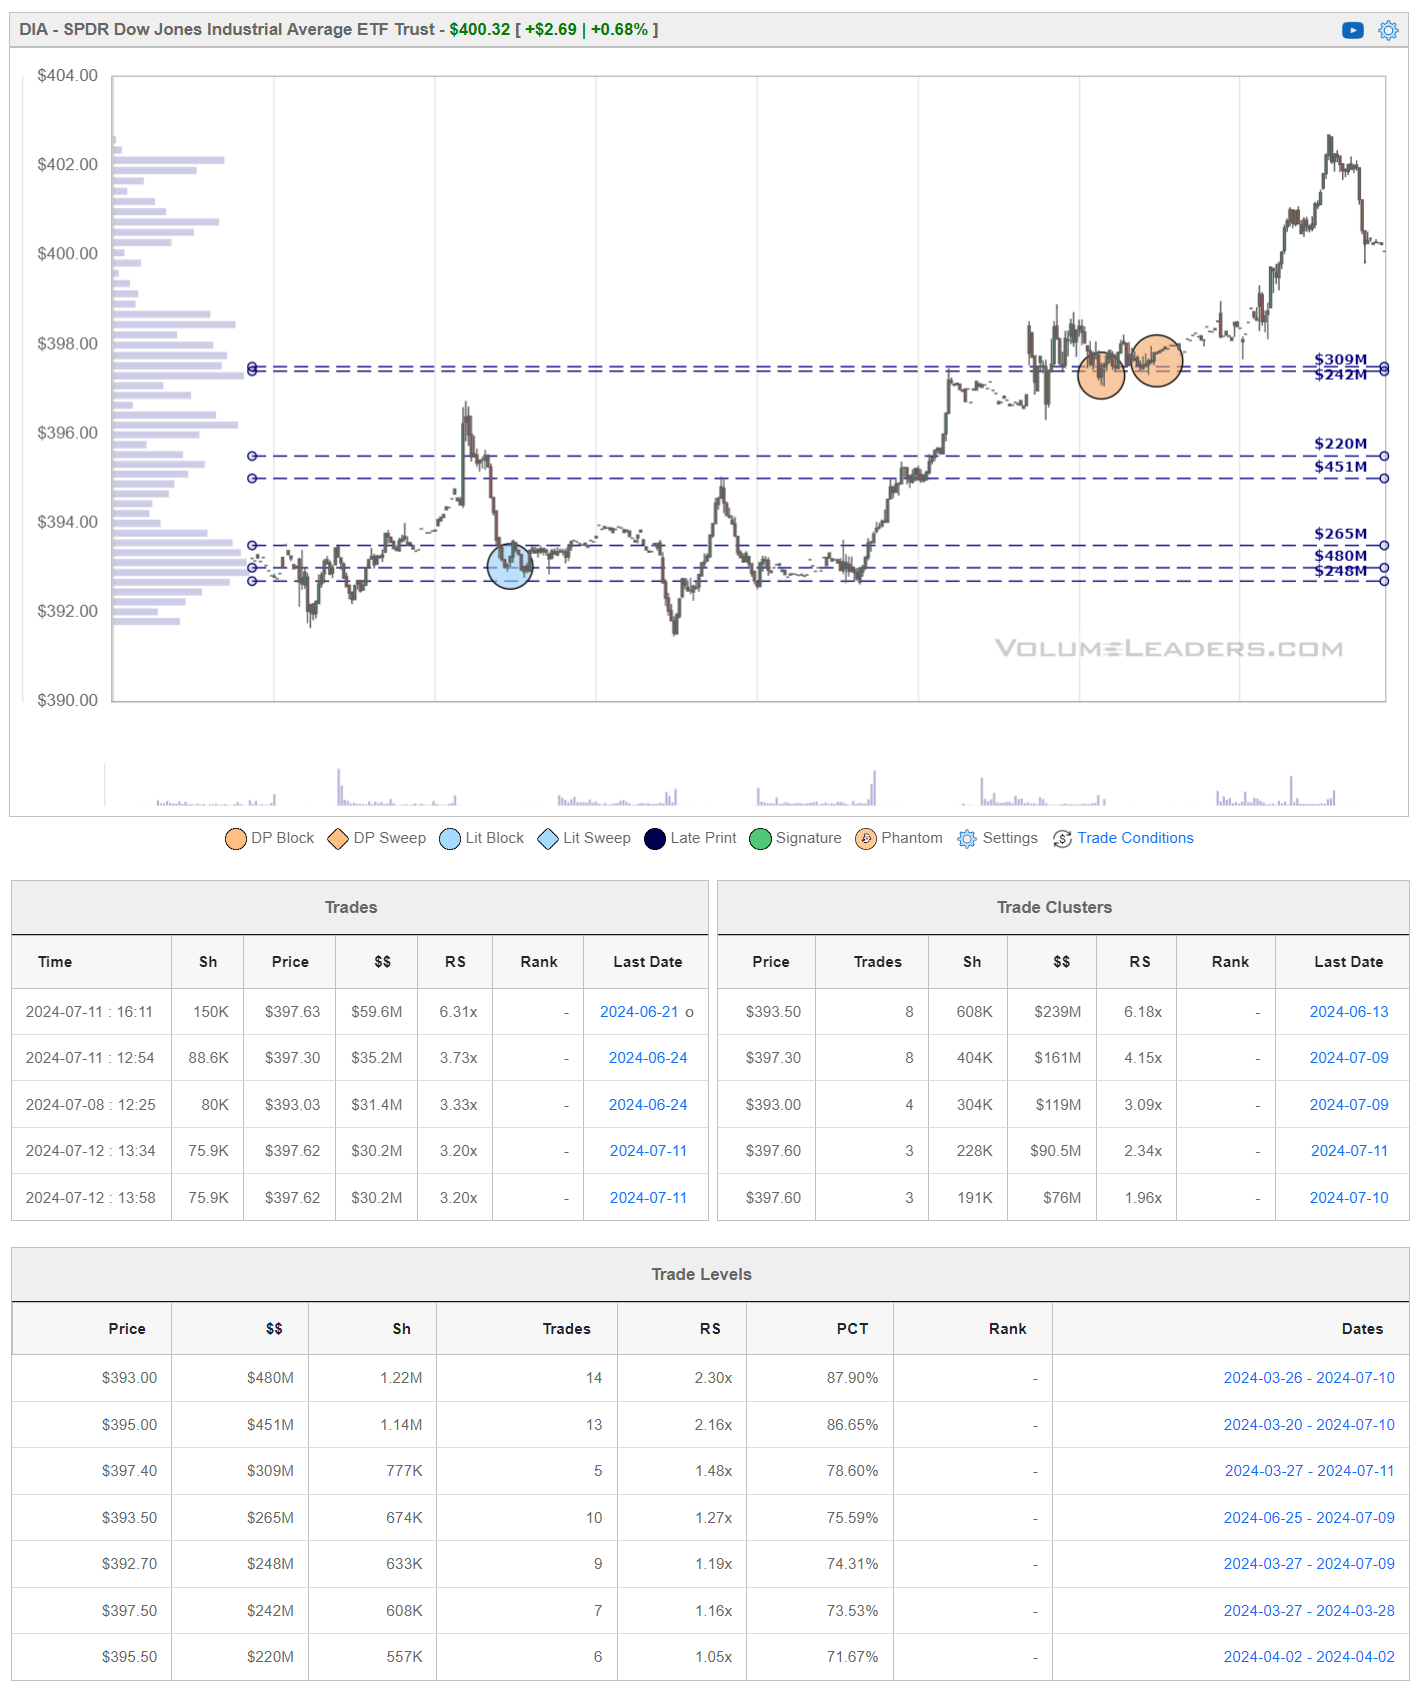
Major Indices Inst. S/R Levels
When you’re a large institutional player, your primary goal is to find liquidity - places to do a ton of business with the least amount of slippage possible. VolumeLeaders.com automatically identifies and visually plots the exact spots where institutions have are doing business and where they are are likely to return for more. It’s one of the primary reasons “support” and “resistance” concepts work and truly one of the reasons “price has memory”.
Levels from the VolumeLeaders.com platform can help you formulate trades theses about:
-
Where to add or take profit
-
Where to de-risk or hedge
-
What strikes to target for options
-
Where to expect support or resistance
This is just a small sample; there are countless ways to leverage this information into trades that express your views on the market. The platform covers thousands of tickers on multiple timeframes to accommodate all types of traders. Observe for yourself how accurate the levels are by marking-up your charts with the free “Trade Levels” I’m giving below to play-along in real-time this week. Current subs will get new levels as they develop in real-time and have access to levels from other time frames. I’m confident you’ll see how clear-cut, intuitive and actionable this information is for yourself.
Get these levels in your inbox every week before the market opens, subscribe now
Subscribe
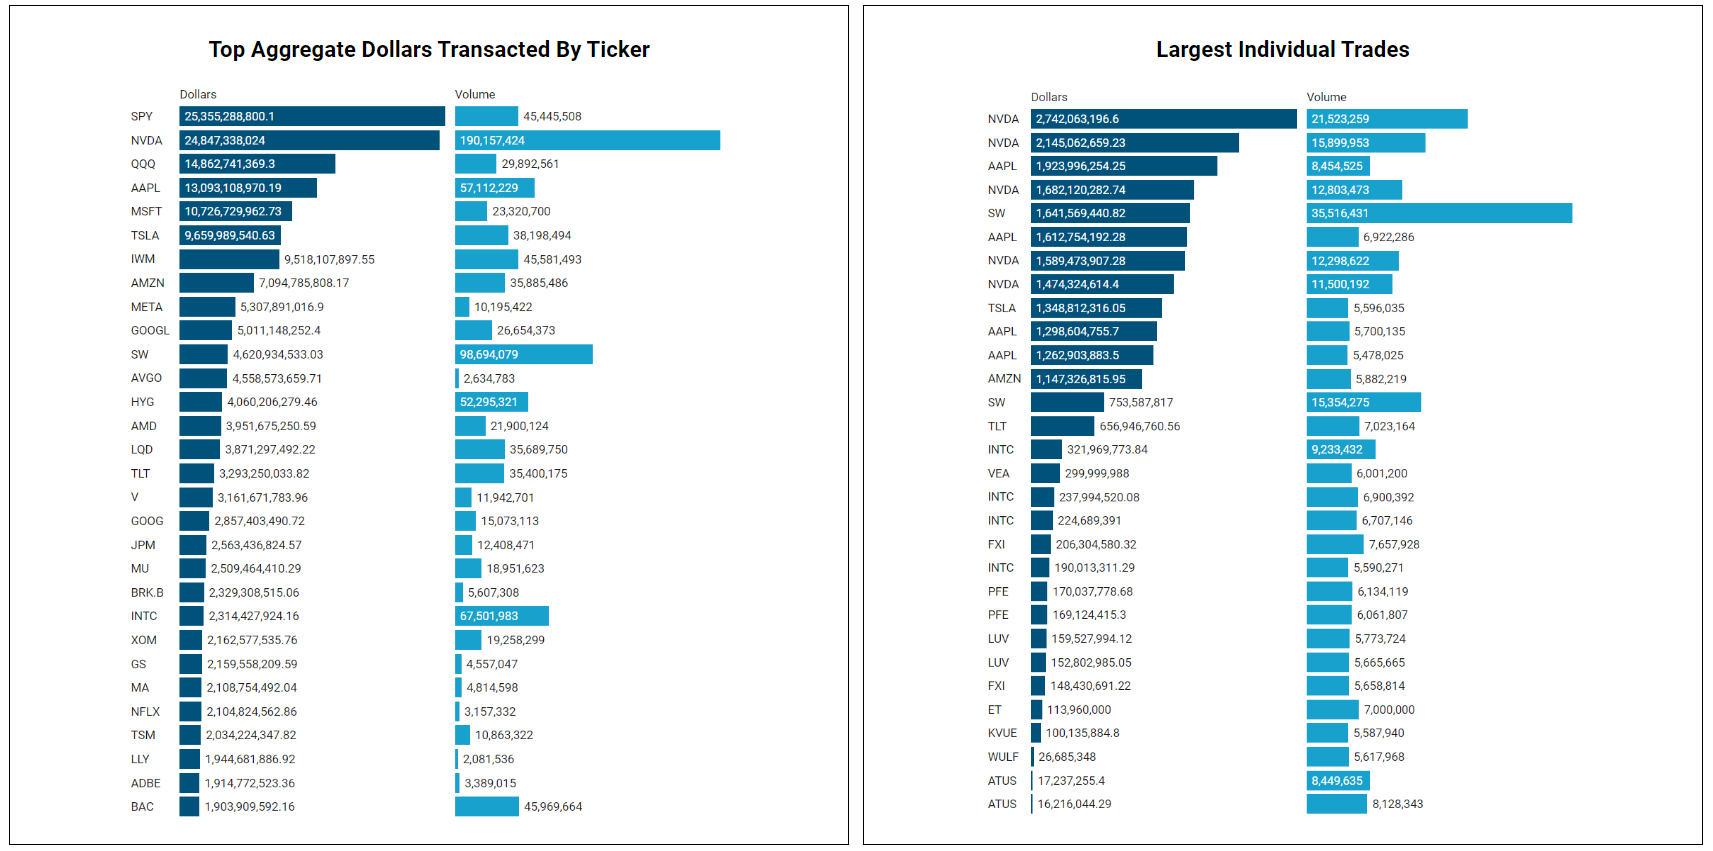
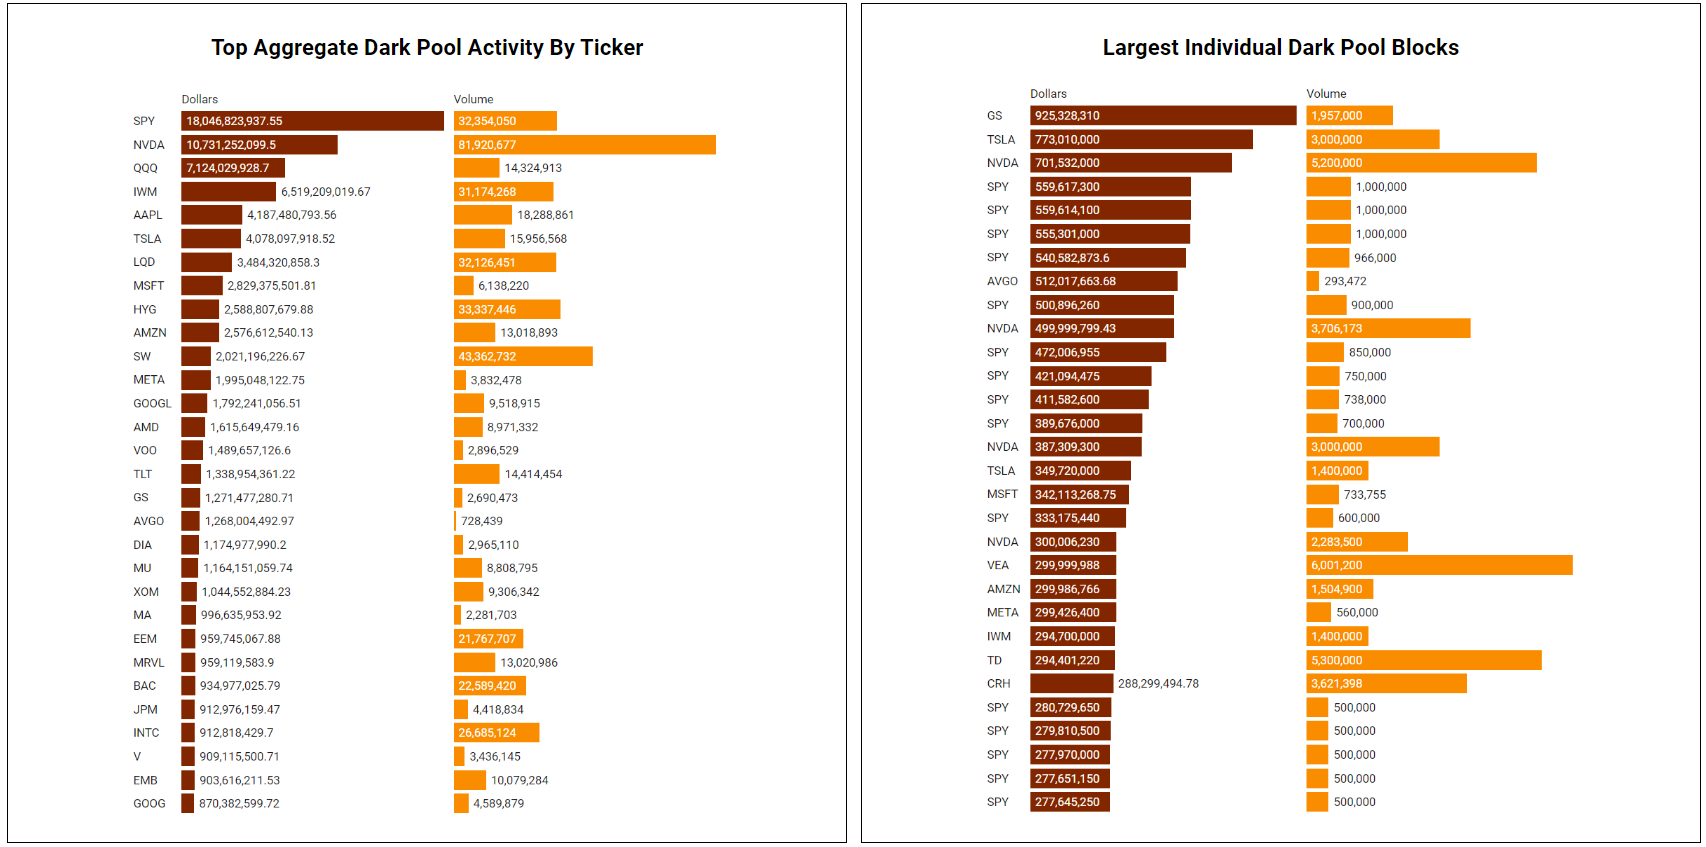
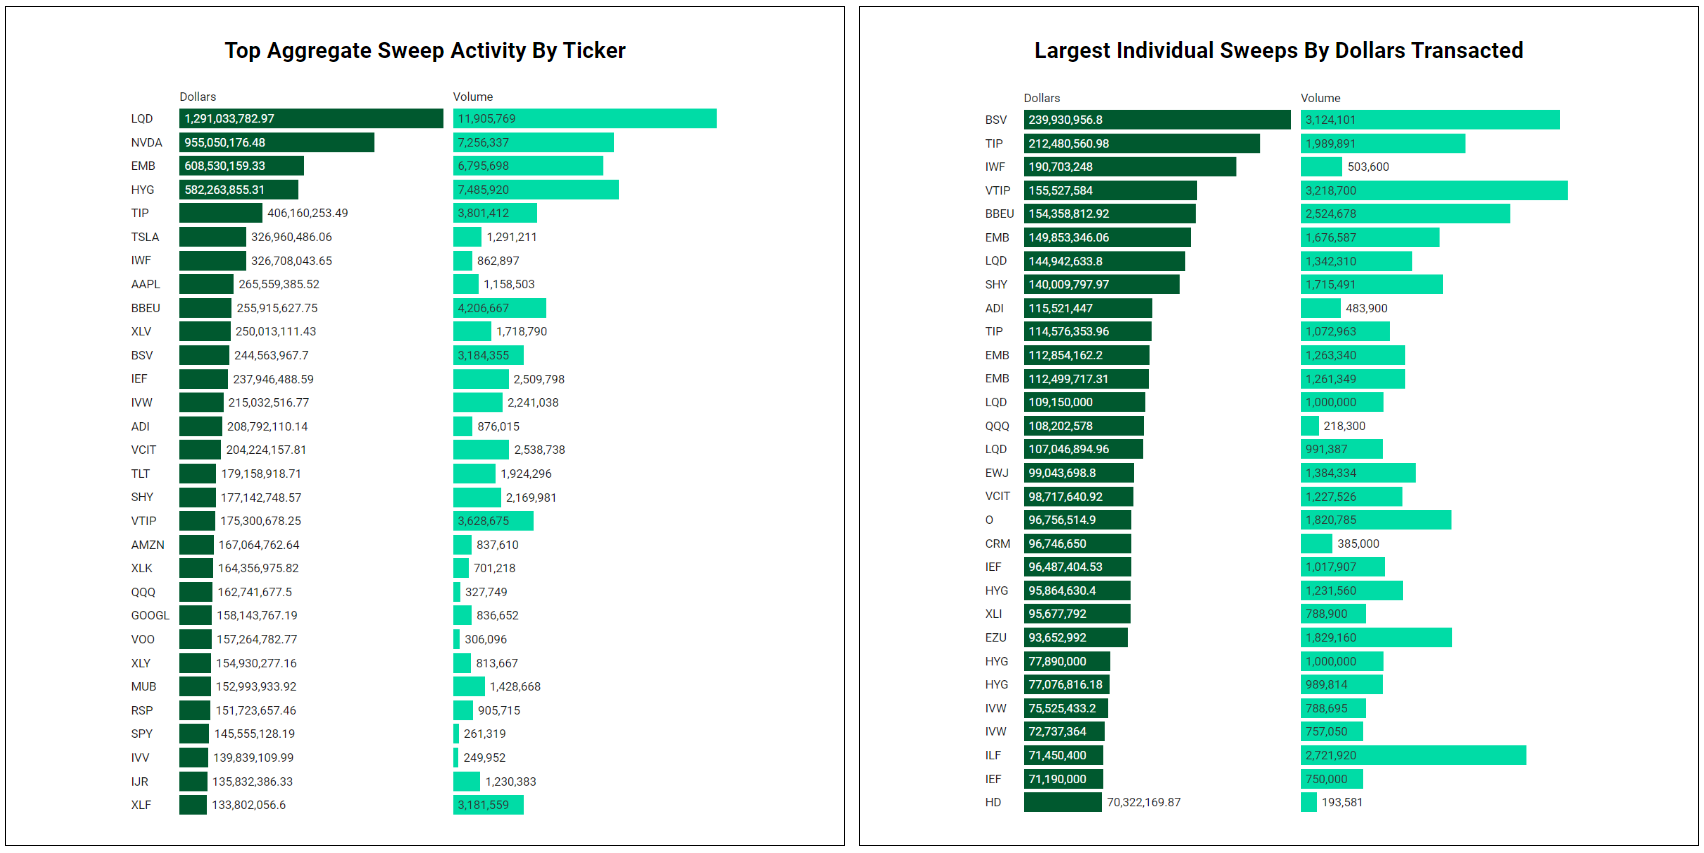
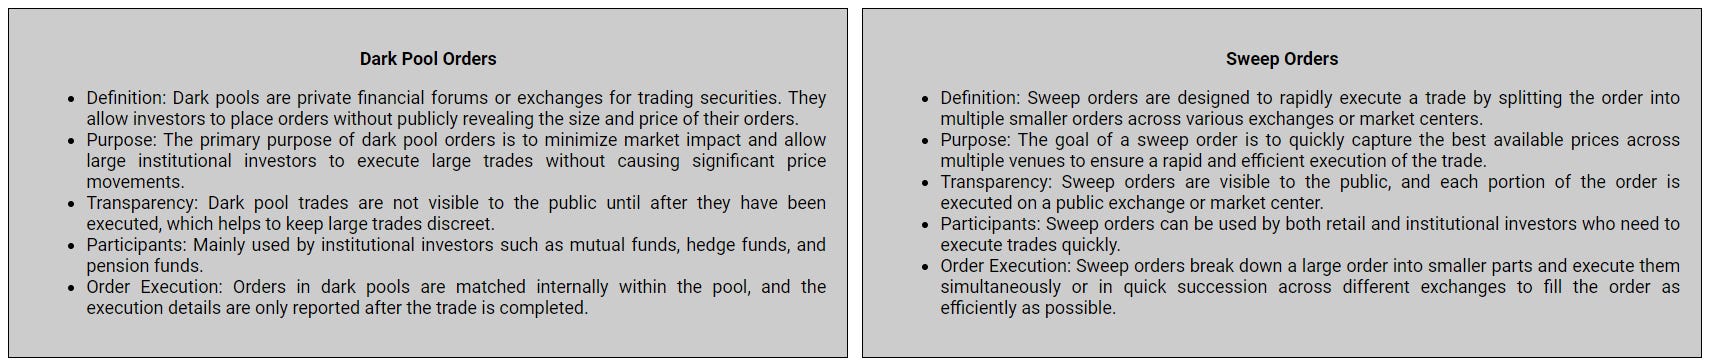
Top Institutional Order Flow
There are often great trades ideas or sources for inspiration in these prints. Only the top 30 of each group are shown but the full results are available in VL for you to browse at your leisure. Don’t forget to setup real-time alerts inside the platform so you never miss institutional order flow that piques your interest. Blue charts include all trade types including blocks on lit exchanges; red/orange charts are dark pool only trades; green charts are sweeps only.
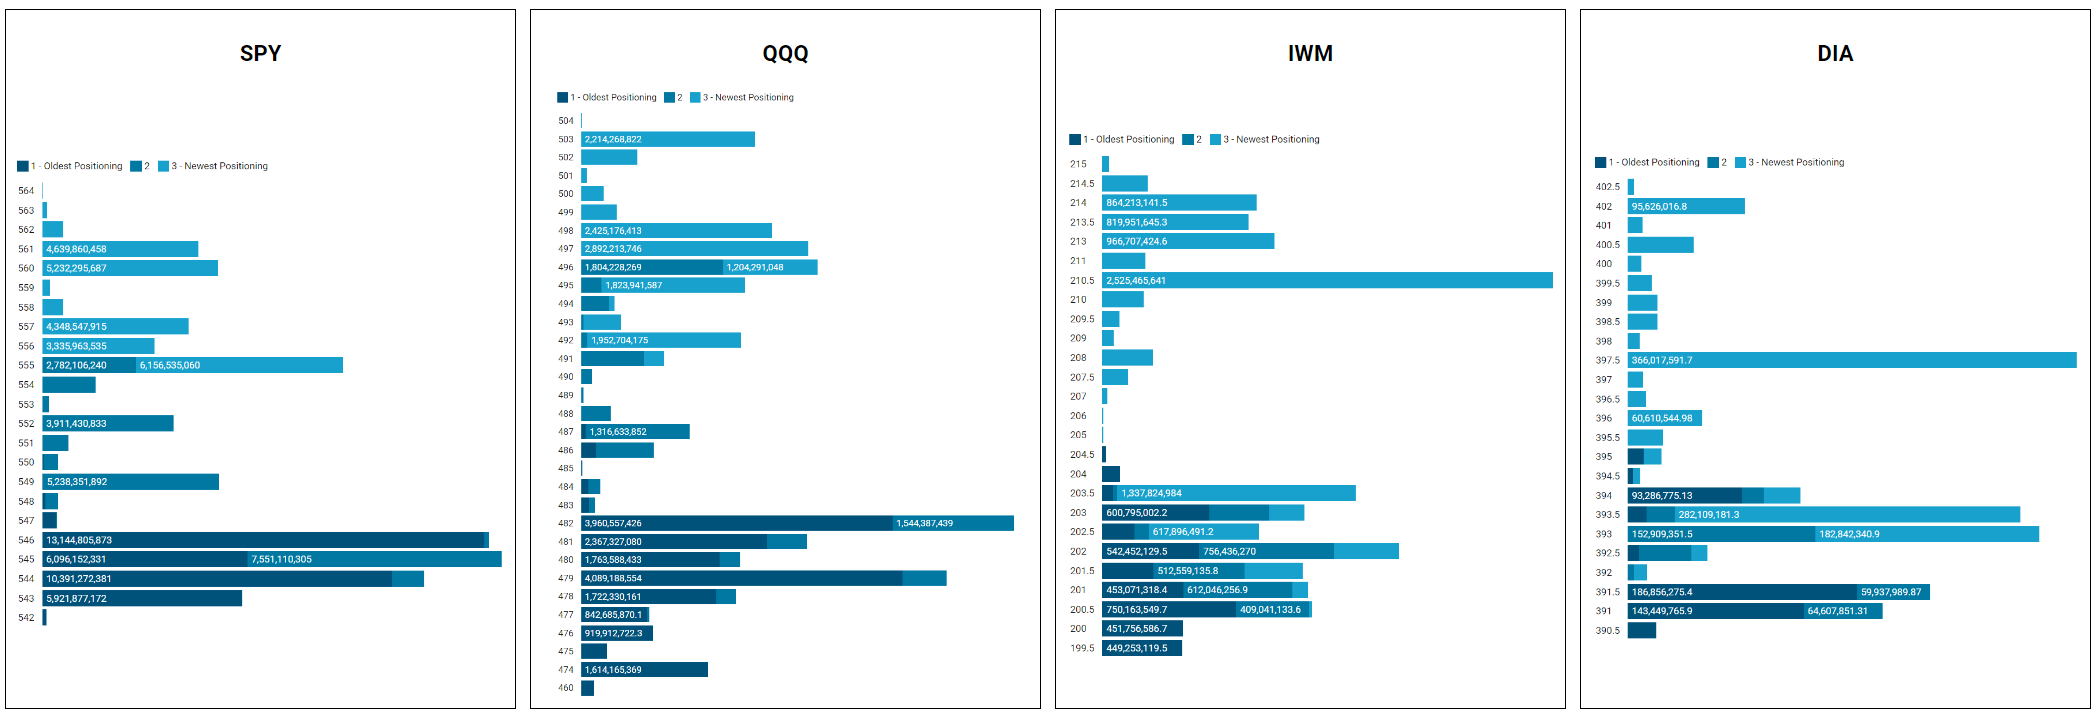
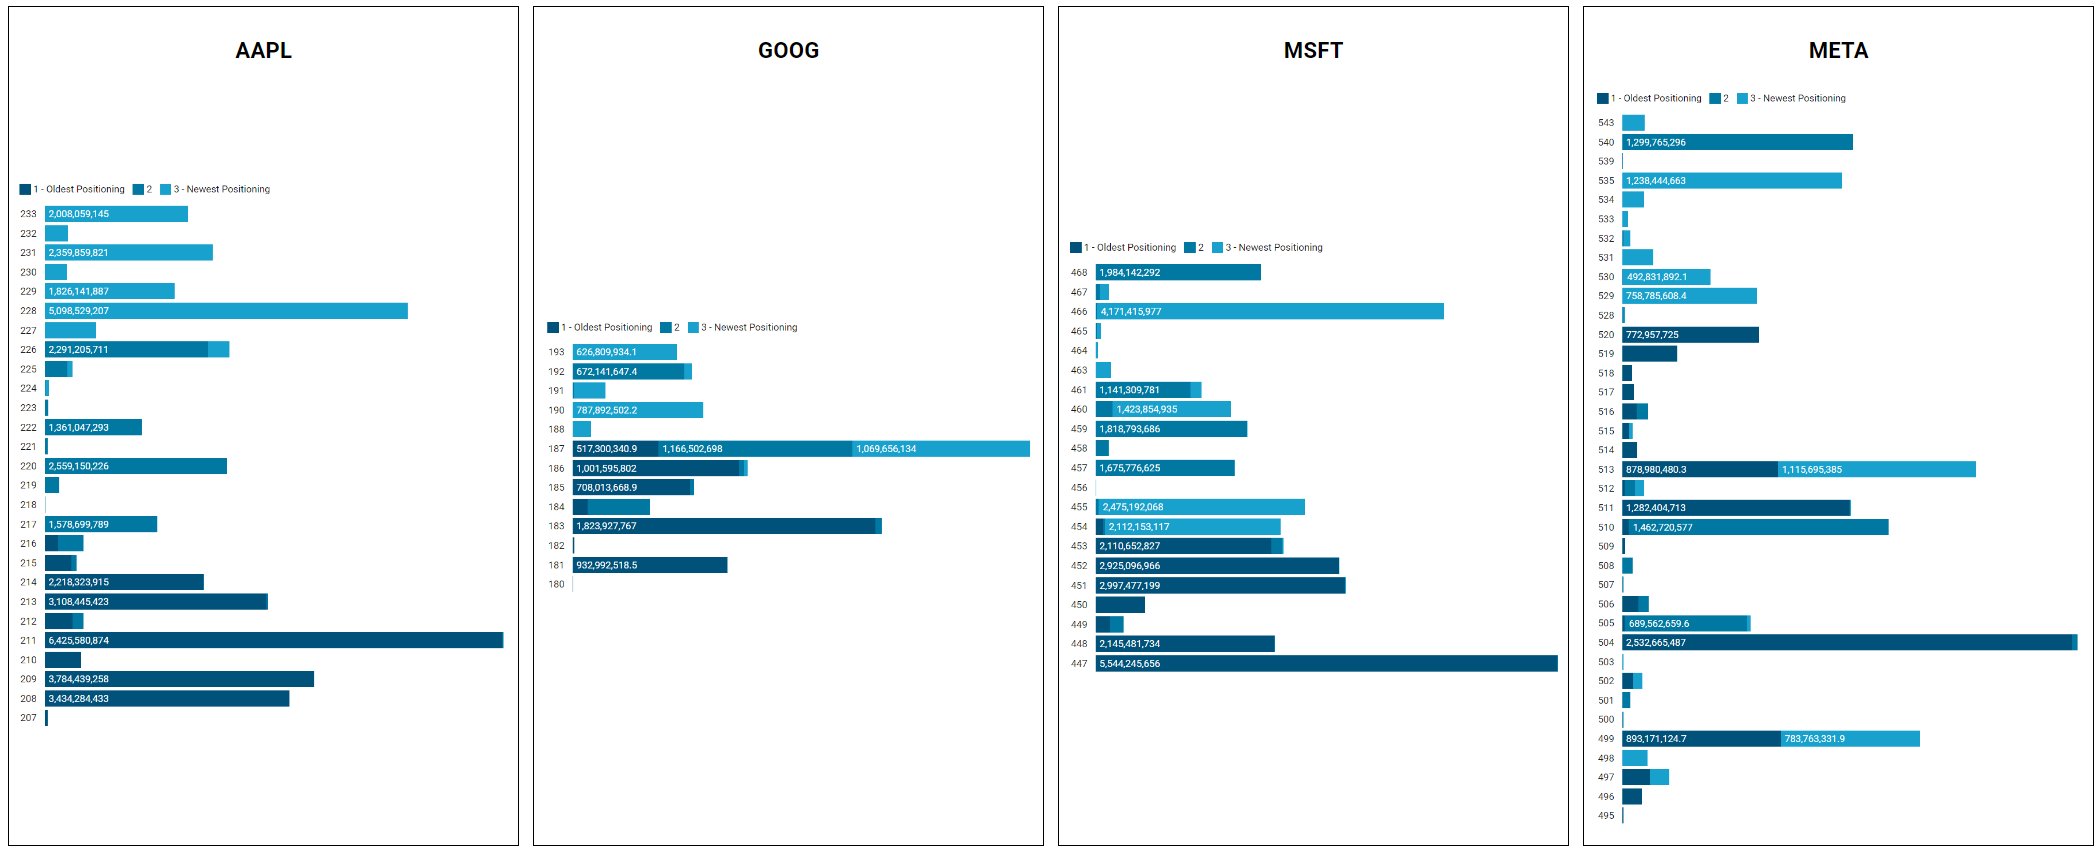
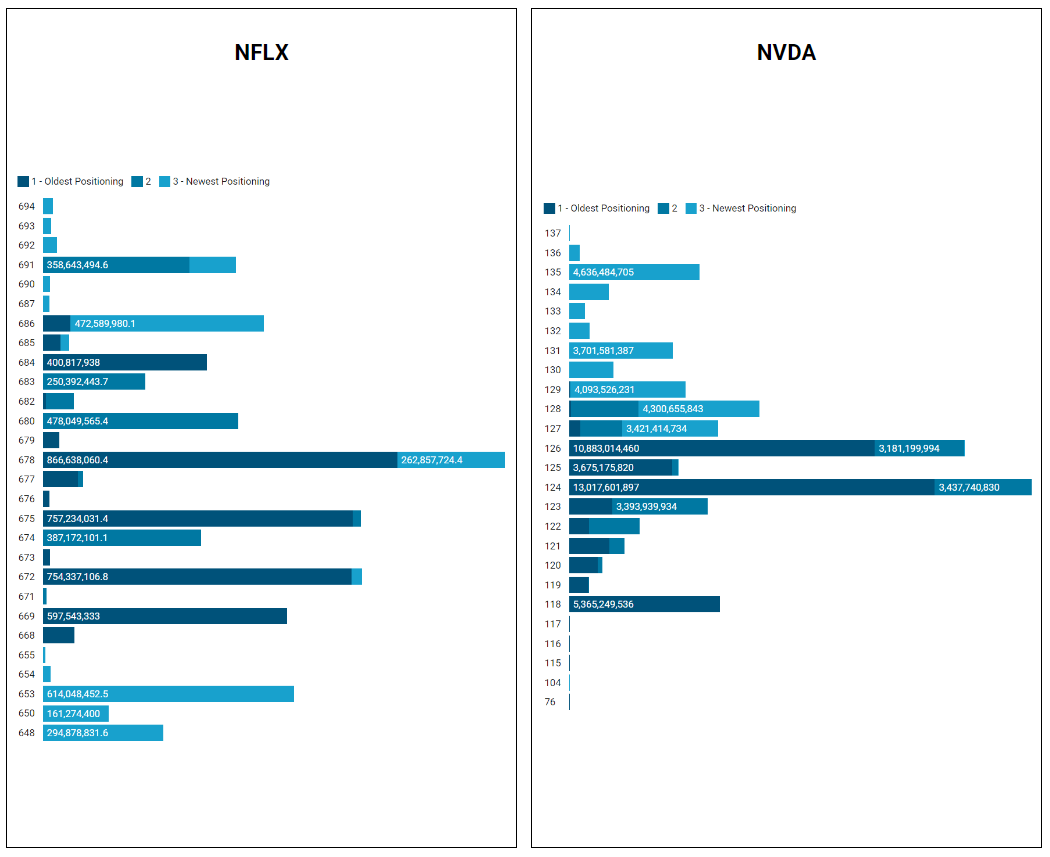
MoneyFlow Charts
When we look at moneyflow charts, we’re visualizing the aggregate institutional activity by price for a given period. The benefit of moneyflow charts is that you have an apples-to-apples comparison of institutional involvement across the entire market because everything is measured by the same yardstick: dollars. If you are familiar with auction mechanics and volume profiling, you can apply the same principles here; wide bars/nodes are magnets and show areas where business is being done and you can expect positioning to be tested and defended, sometimes multiple times; narrow bars represent little interest or less-success in doing business at that price and work as pass/fail levels to define buyer or seller success. A final note: the color gradients represent the age of positioning; the darkest colors are roughly 3 weeks old and the lightest are the most recent week.


Indices
Mag7
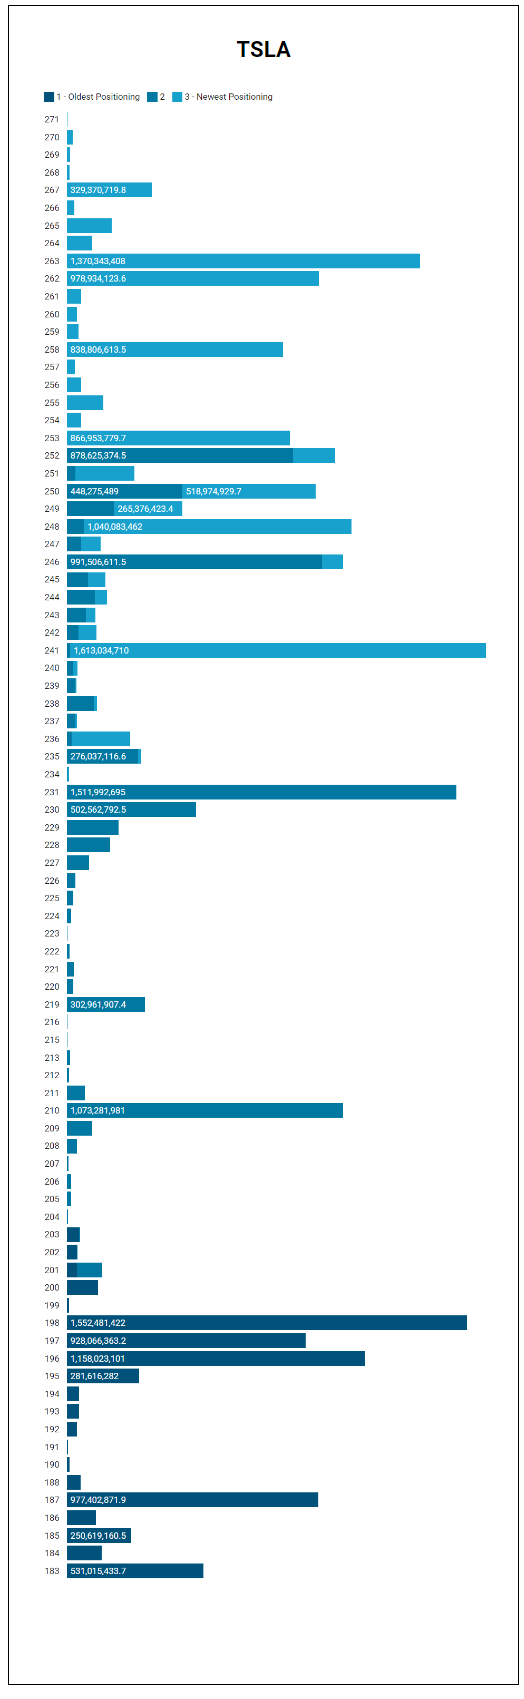
(TSLA is just ridiculous…I’ve got some ideas to re-jig my visualization tools to output something more sane-looking next week)
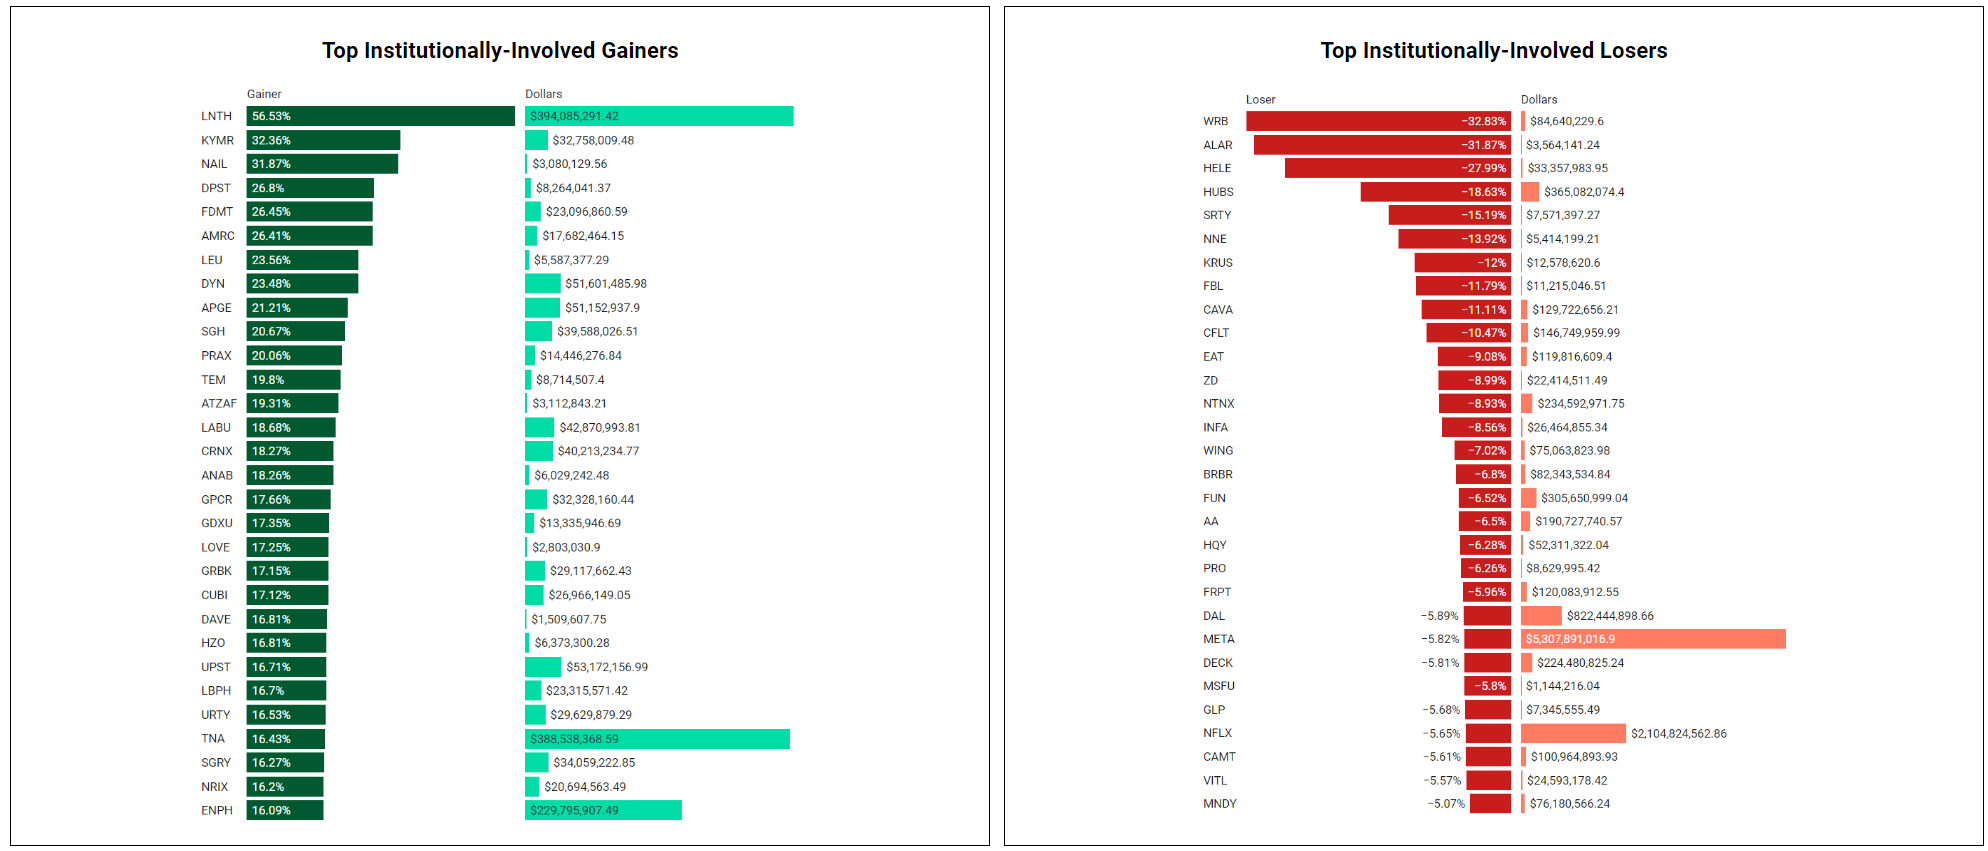
Institutionally-Backed Winners & Losers
If you’re going to bet on a horse, consider one that is officially endorsed by an institution! These are the top percent gainers (green) and and percent losers (red) from this week’s open-to-close that had a trade price greater than $20 and institutional involvement. Continue watching tickers from prior stacks as these frequently turn into larger momentum plays where the winners stay winning and the losers keep losing.
Billionaire Boys Club
Tickers that printed a trade worth at least $1B last week get a special shout-out. Welcome to the club. The table below is sortable, searchable and paginated (if there are enough results; some weeks are busier than others). Login to VL to get the exact trade price and relevant institutional levels around the trade.
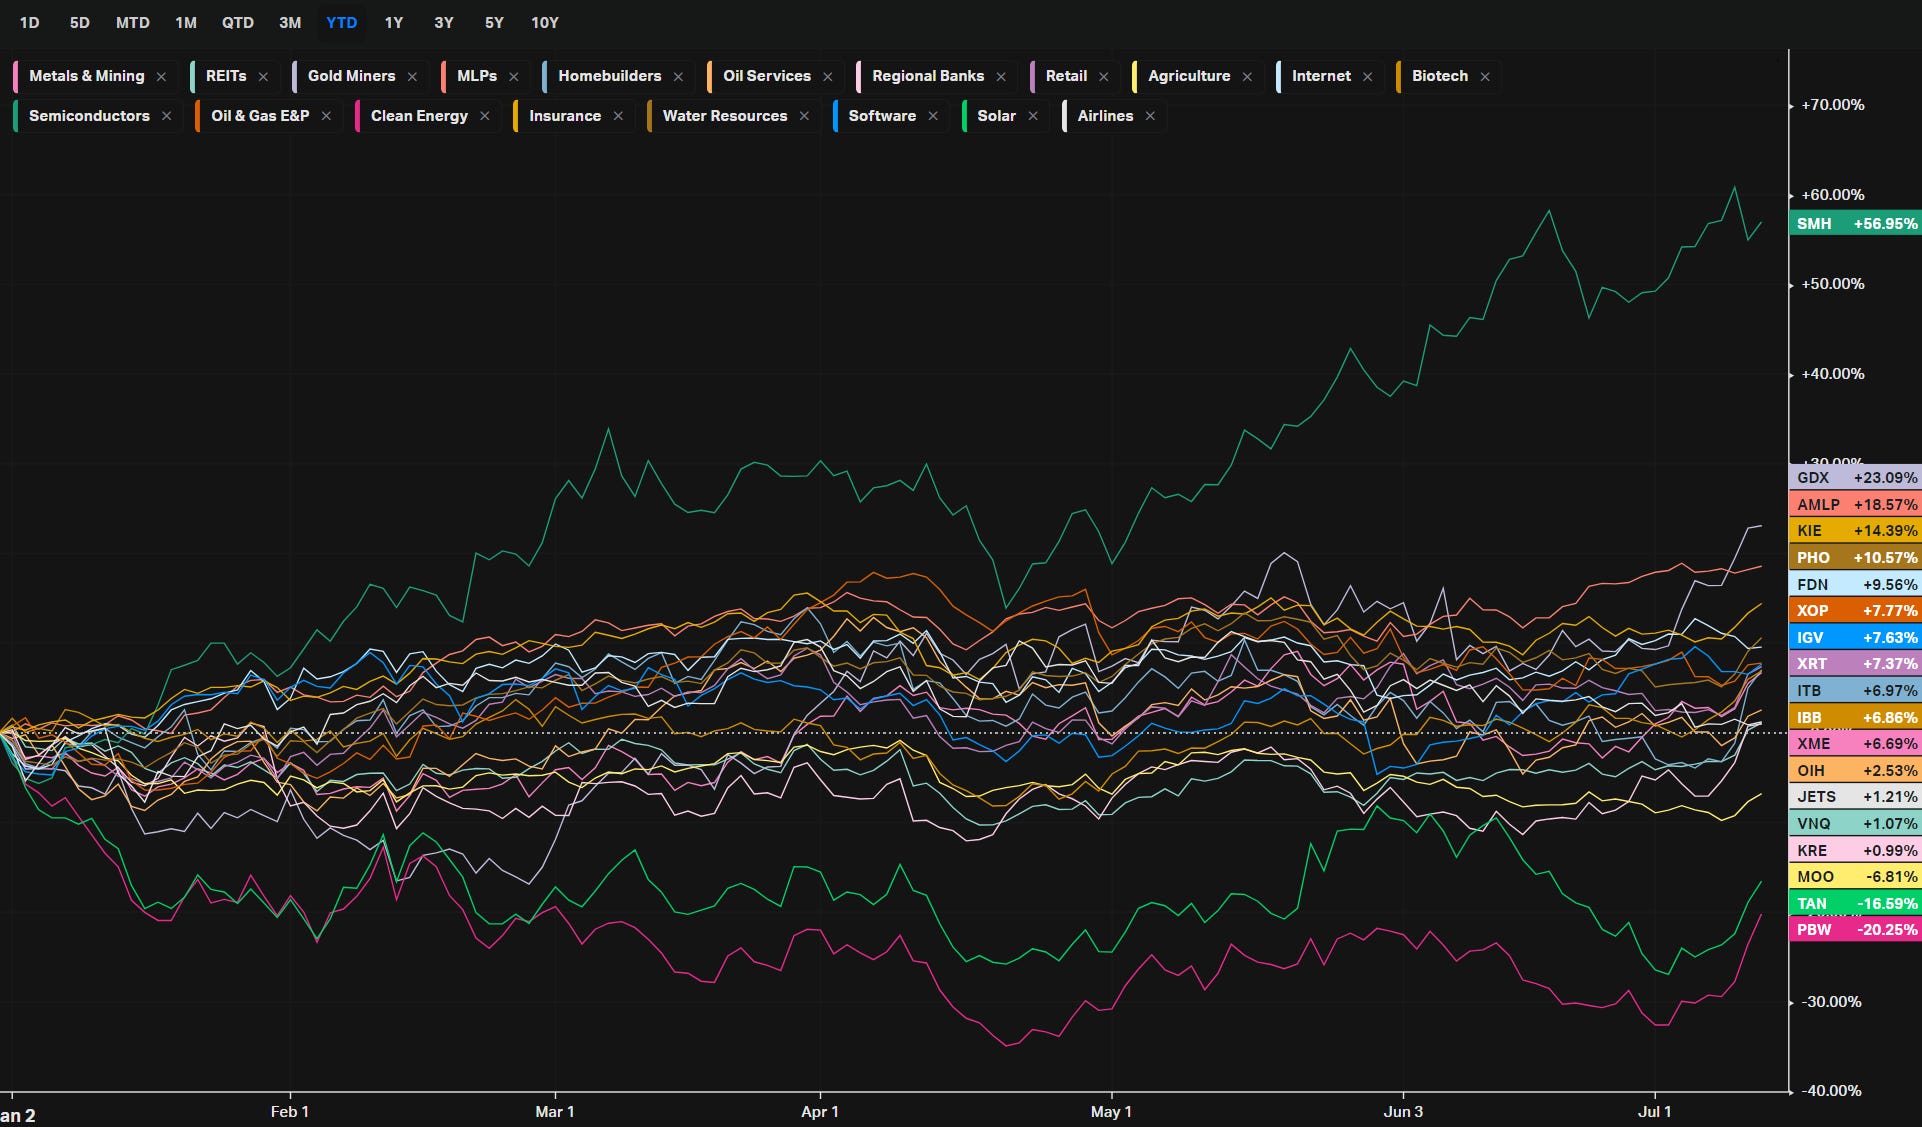
Summary Of Thematic Performance
VL provides a lot of pre-built filters for thematics so that you can quickly dive into specific areas of the market. These performance overviews are provided here only for inspiration. Consider targeting leaders and/or laggards in the best and worst sectors, for example.
YTD S&P Sector Performance
YTD S&P Industry Performance
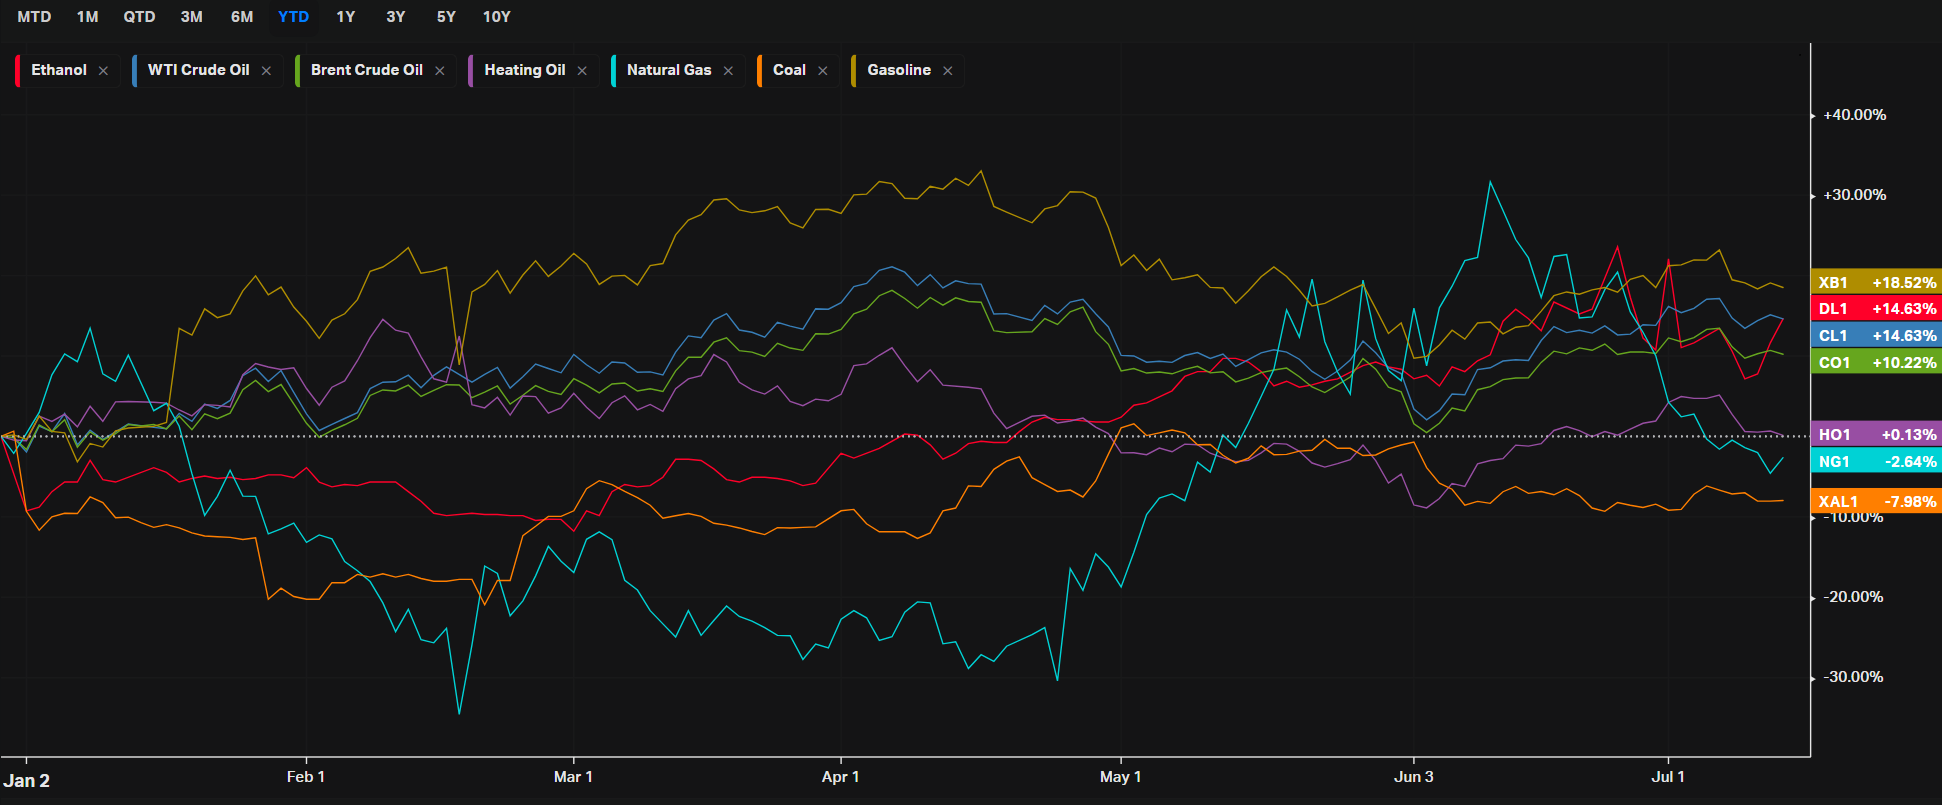
YTD Performance: Energy
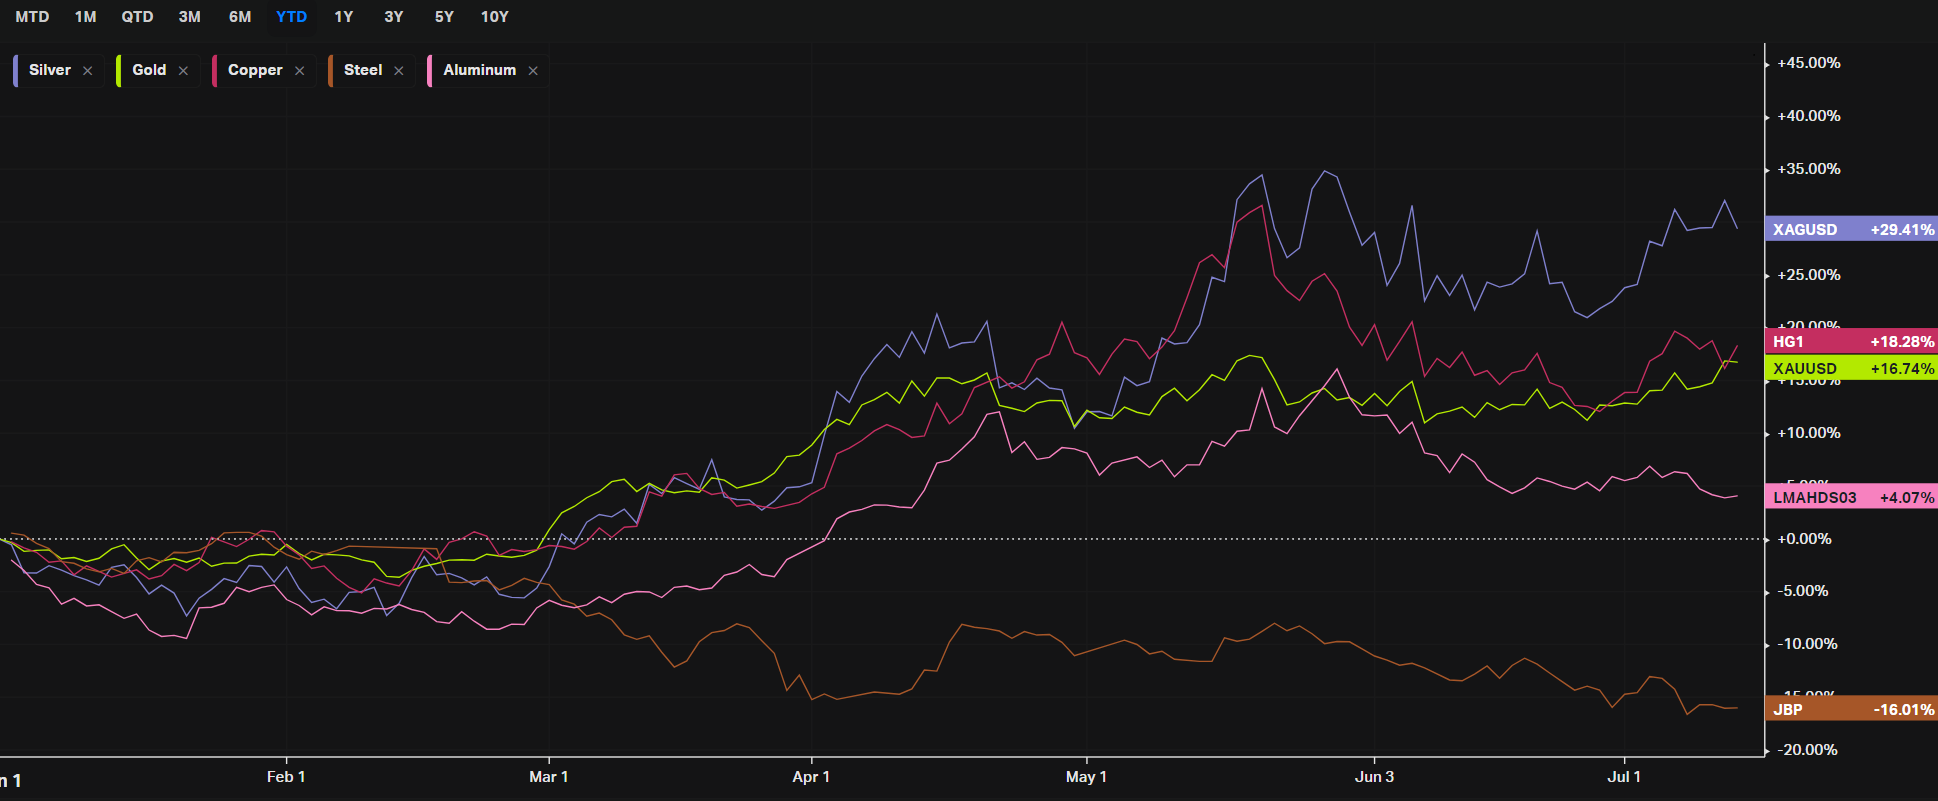
YTD Performance: Metals
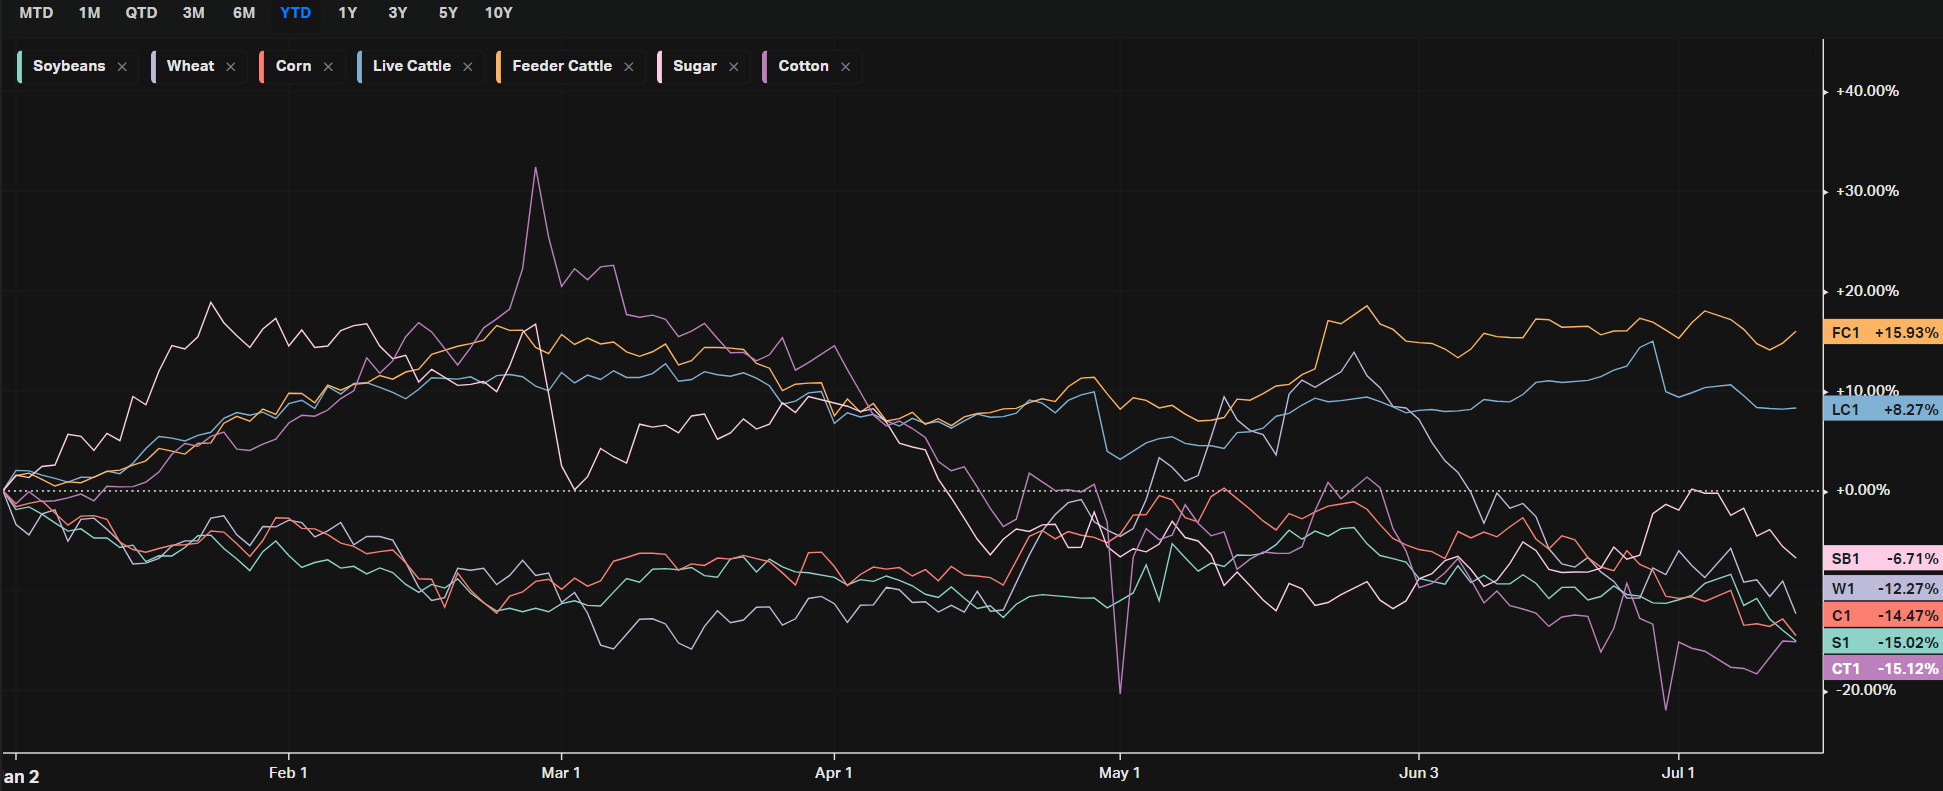
YTD Performance: Agriculture
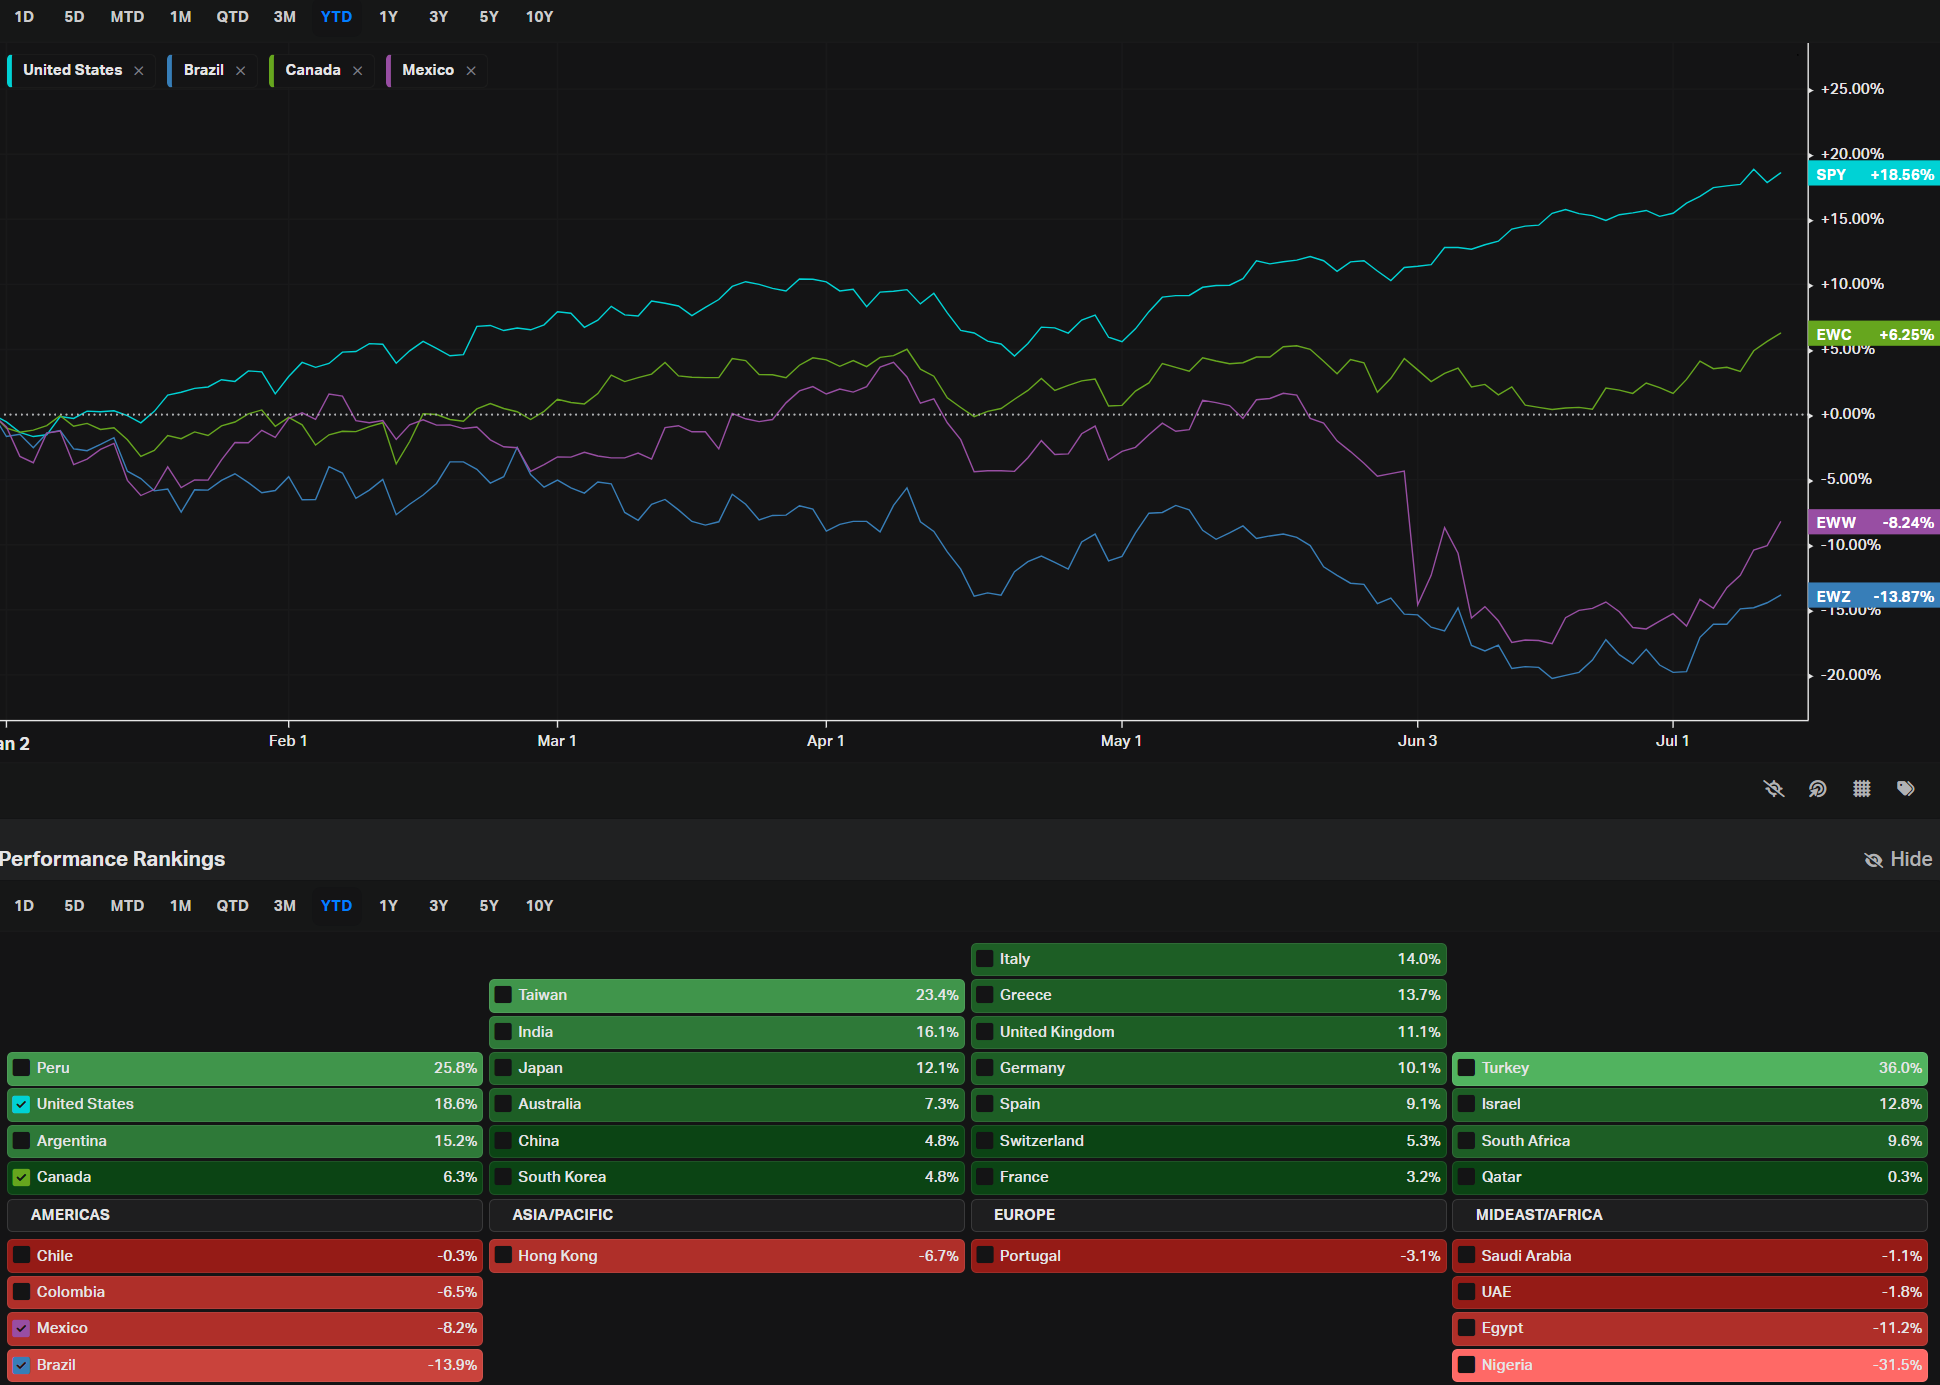
YTD Performance: Country ETFs
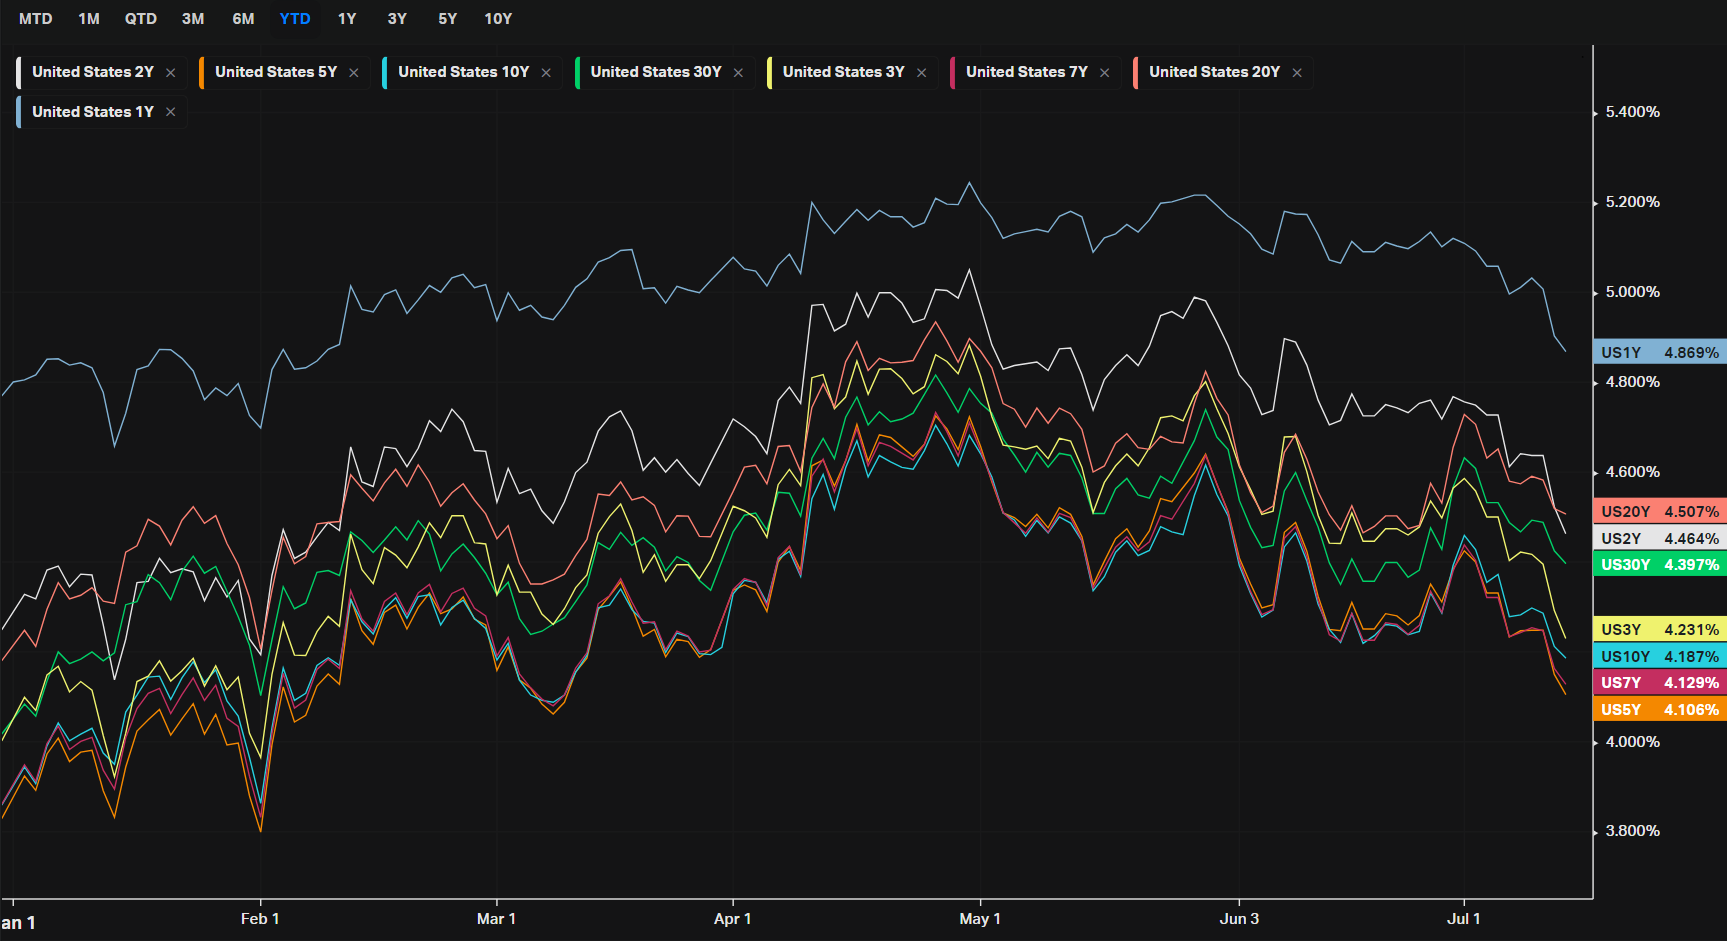
YTD Performance: Yields
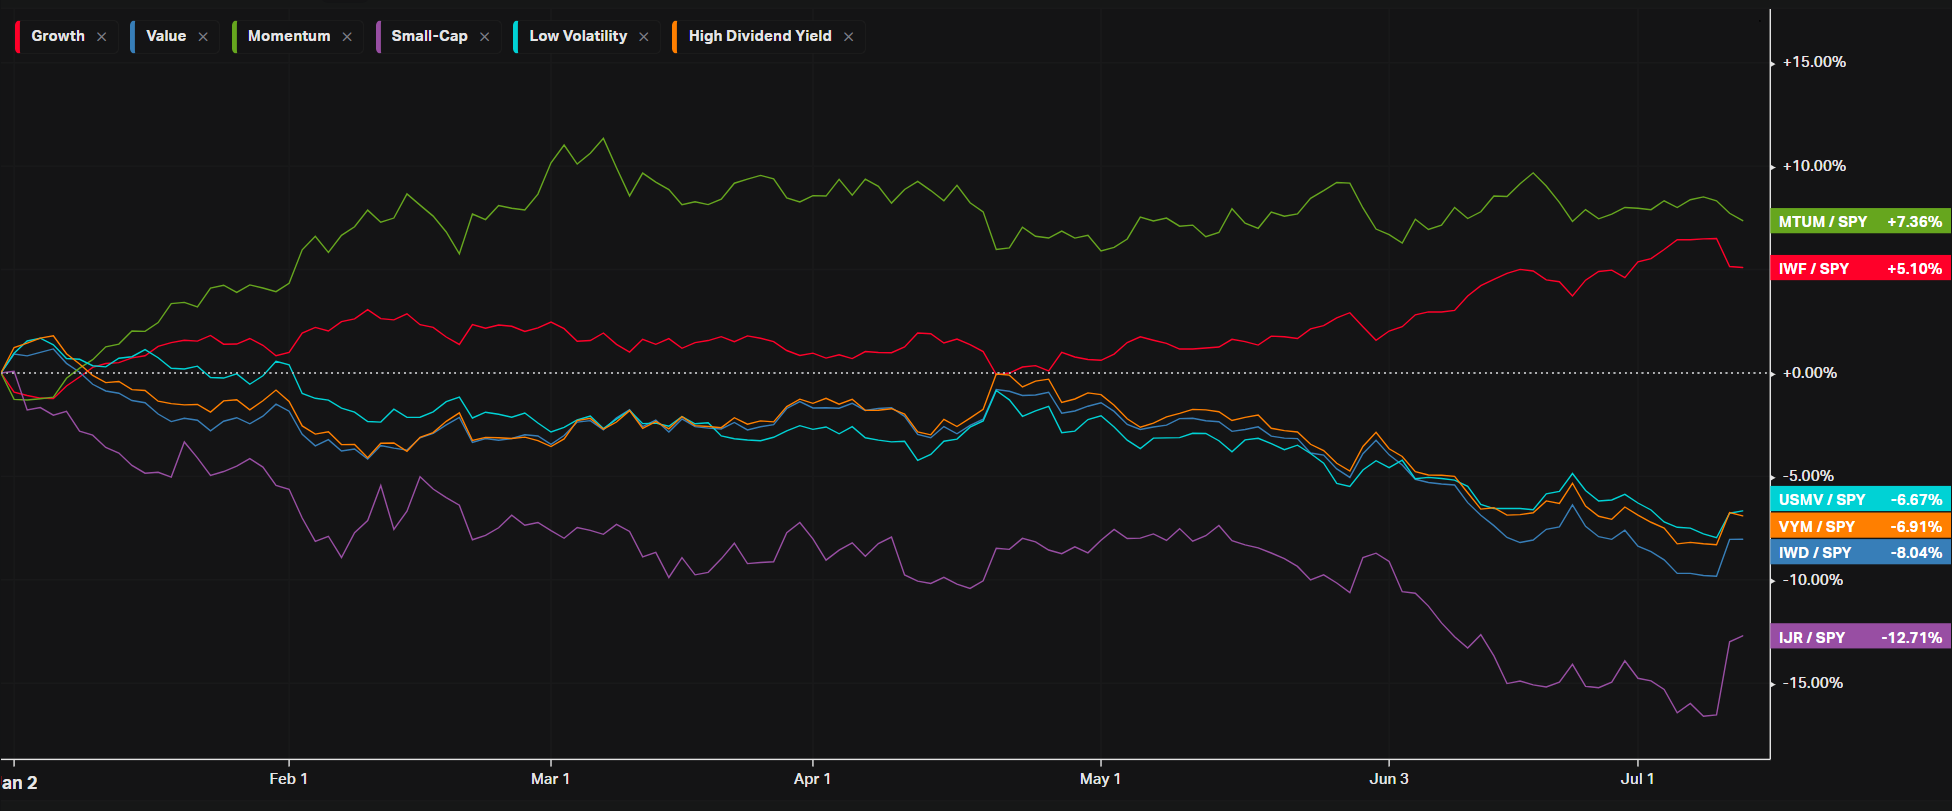
YTD Performance: Size vs Value
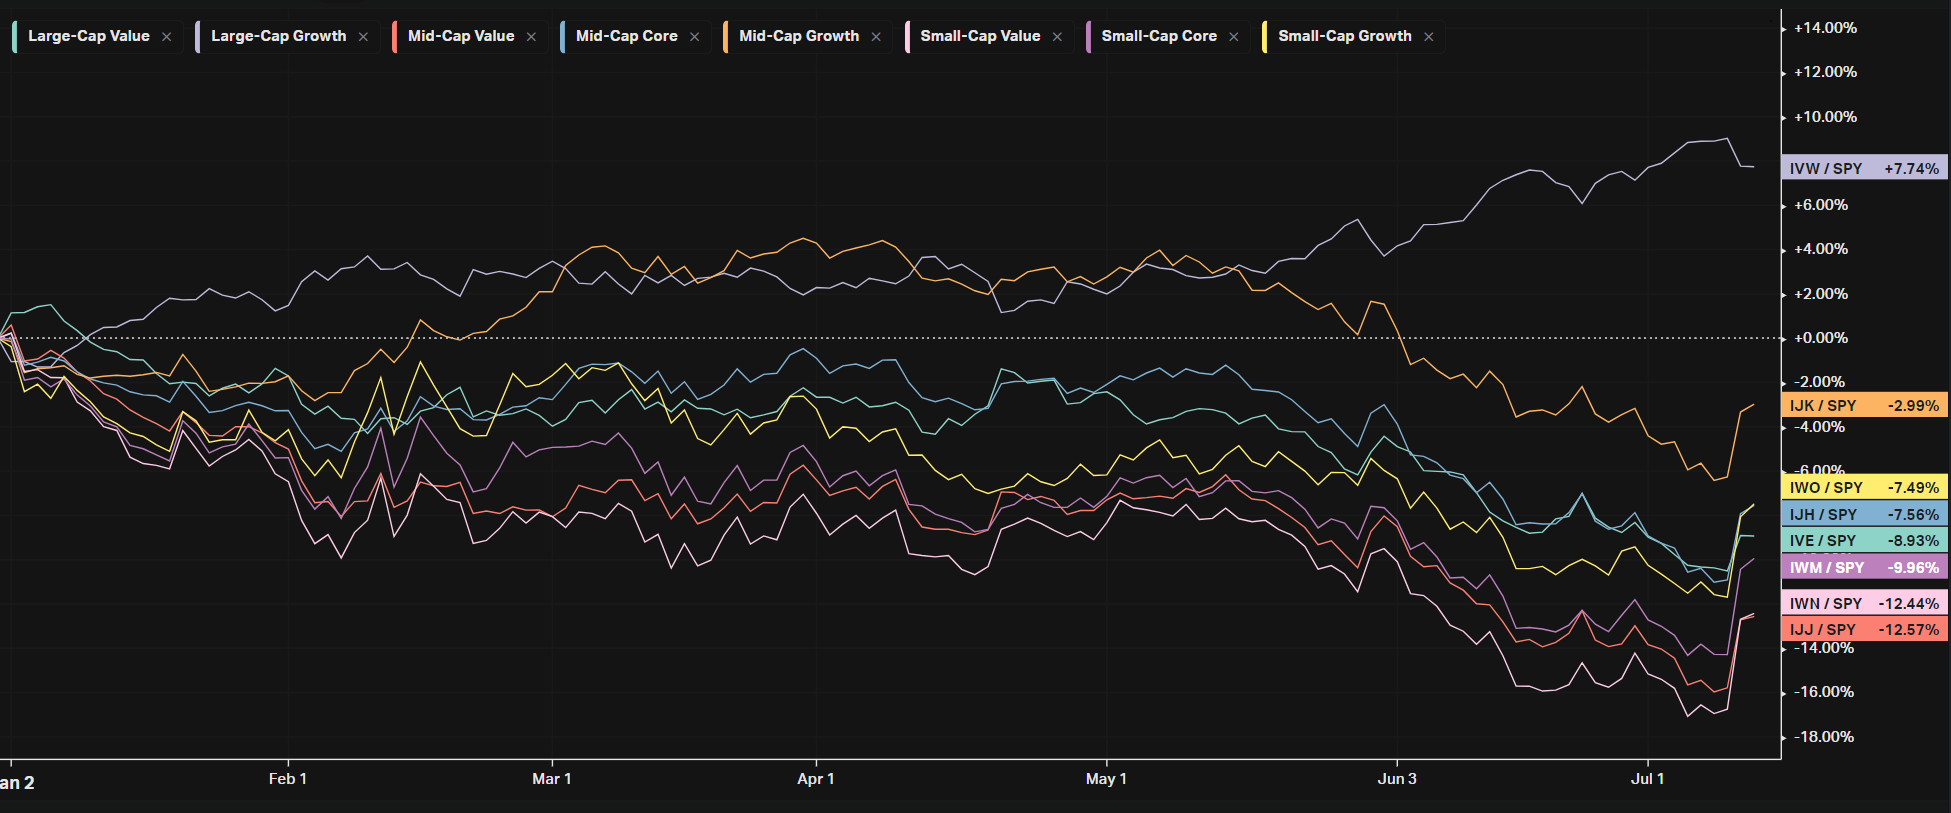
YTD Performance: Style
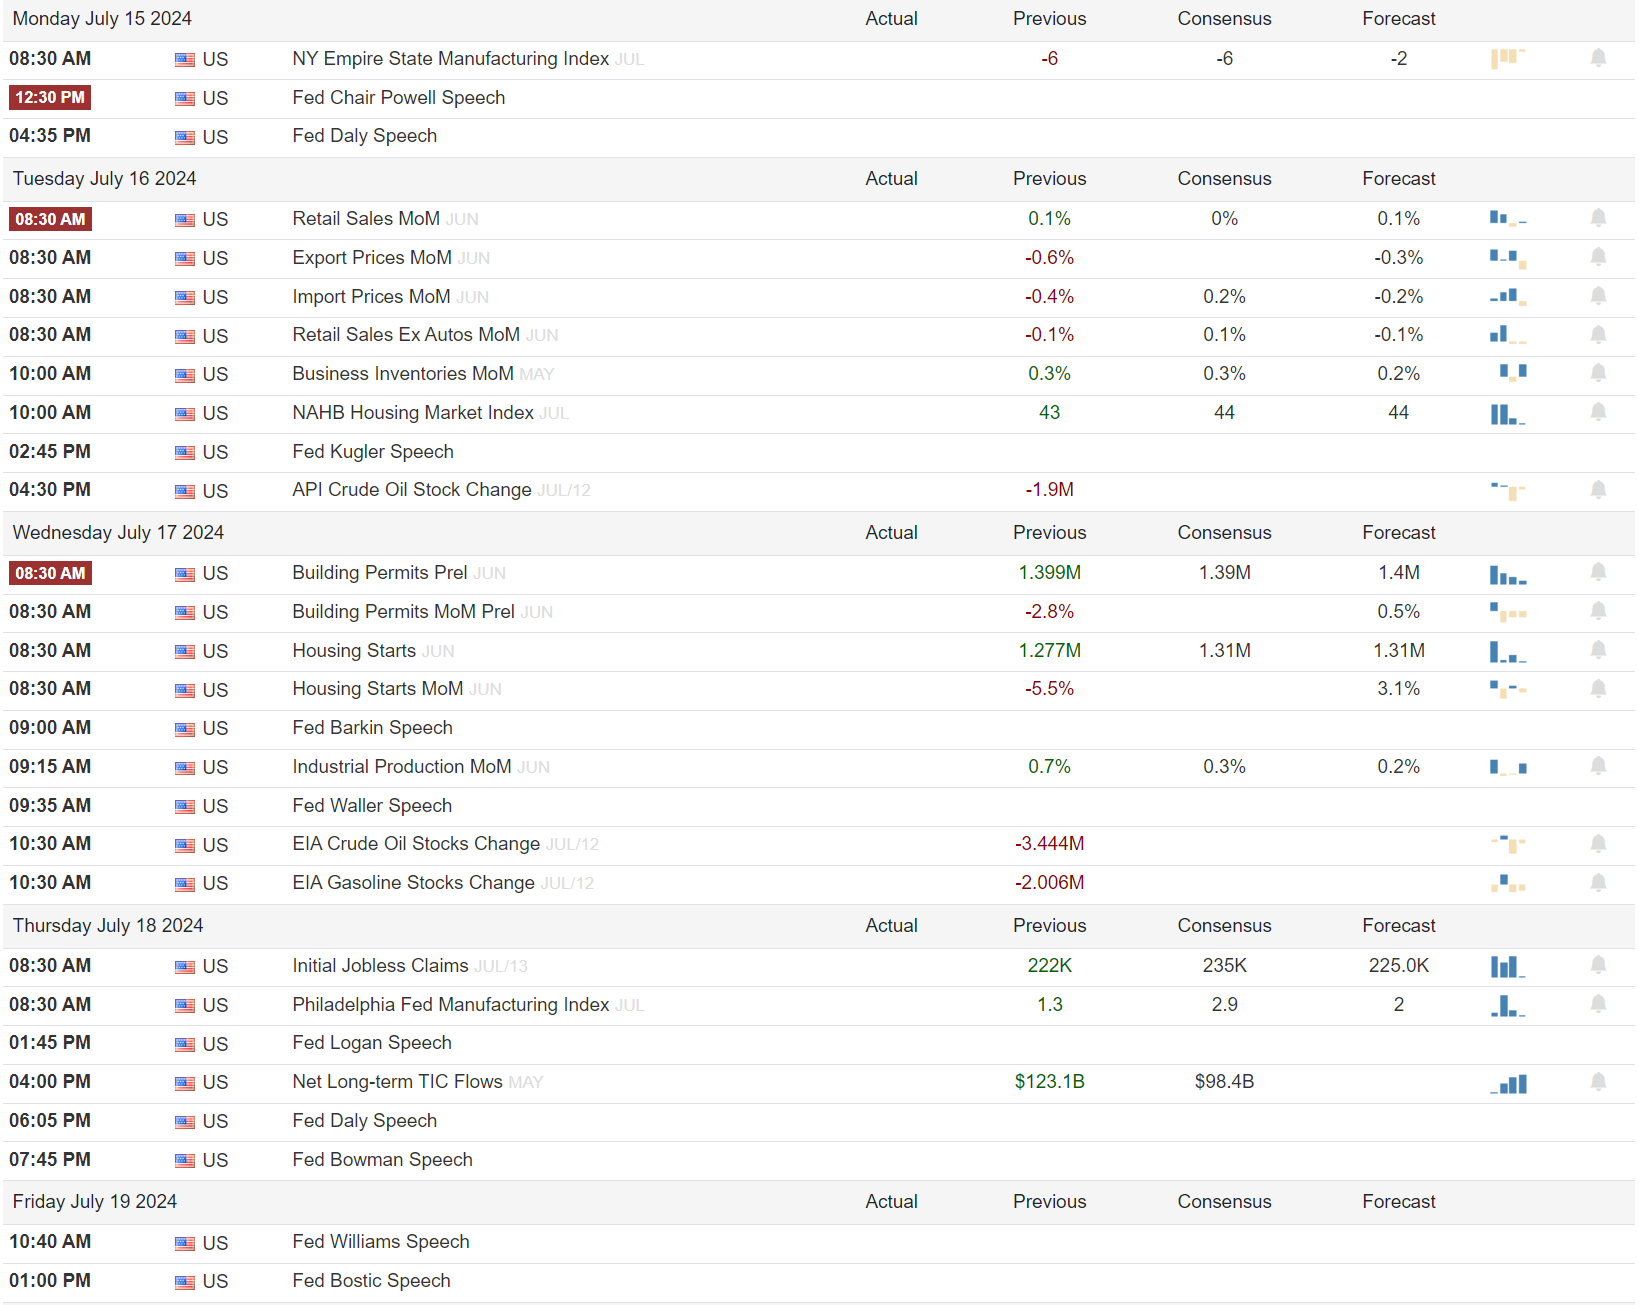
Econ Events On Deck This Week
Here are key economic events happening this week that have the potential to cause outsized moves in the market or heightened short-term volatility.
checkout VolumeLeaders.com for your own free trial of the platform that brings you the data powering this stack. Wishing you all a green week filled with many bags.
Originally posted at https://volumeleaders.substack.com
This article is from an unpaid external contributor. It does not represent Benzinga's reporting and has not been edited for content or accuracy.
© 2025 Benzinga.com. Benzinga does not provide investment advice. All rights reserved.