Zinger Key Points
- AI stock surges after strategic alliance with Microsoft, then pulls back due to profit-taking.
- Get Wall Street's Hottest Chart Every Morning
On November 19 this year, C3.ai Inc. ($AI) stock got a massive boost as the company formed a strategic alliance with Microsoft ($MSFT) to increase the adoption of AI. The response was fast and furious, with AI gaining +26% on the day and +50% over the next 5 sessions hitting a peak just shy of $40. However, the bullish hue has soured a bit pulling back the last 3 sessions and dropping 10%.
We're going to examine whether the bull run is over and how to trade it using our PFP system (positioning, flows and price action).
Options Positioning in $AI
Looking at the options positioning in the ticker, our proprietary apps tell me we have about 25% of the notional gamma coming off the board this Friday and another large chunk for the December options expiration (op-ex). With three out of every five options being a call, we have to assume there are more calls coming off the board than puts.
This leaves the stock weakening in the short term, and so this current pullback seems warranted.
However, the topping around $40 seems natural from a positioning standpoint as this is the TCS (top call strike), so I suspect profit taking and the culling of long calls is the main culprit behind this pullback.
The TGS (top gamma strike) is at $35, so I wouldn't be surprised to see the stock start to stick around the $35 strike to end the week. As long as we hold $30, we retain a bullish hue on the stock and will look to buy dips. Thus, positioning wise, I'm still bullish and looking to buy, despite the 10% pullback targeting $40/41 for the December op-ex.
Only on a daily close under $30 would I shift to bearish.
[Get the Market’s Fastest-Growing Stocks for 75% Off]
Price Action in $AI
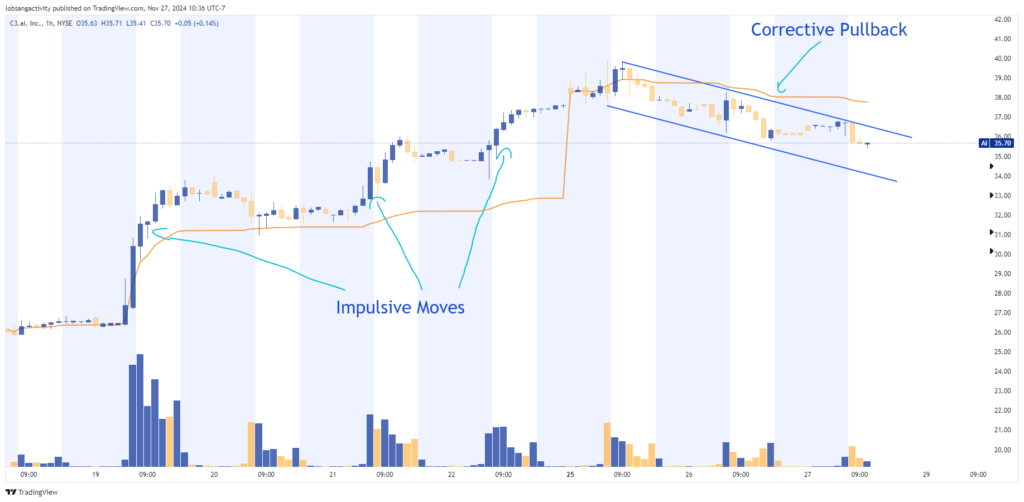
In alignment with the positioning, if we look at the chart below, we can see there are three impulsive moves in response to the partnership news with Microsoft showing a high imbalance with the bulls.

1-hour $AI chart
The pullback over the last three sessions has been ‘corrective' which suggests a low imbalance of put buying and/or call selling. This means the overall price action is communicating the flows are still more likely to be bullish if they come in with size/verve.
Hence, the overall price action is still leaning bullish.
Flows in $AI
While the flows on the day are a mild amount of call selling and an even milder amount of put buying, these notional deltas are nowhere near pushing ‘impulsive/aggressive', thus overall the flows (while mildly bearish in the last 3 sessions), we suspect this is part holidays and part profit taking with no aggression to the downside.
Until I see real verve in the selling/put buying, the overall flows are leaning bullish over a medium term, thus we're retaining a bullish contour on the stock.
How We're Trading $AI
We're looking to buy dips in $AI targeting $40 for the Dec op-ex and perhaps $45 for the Jan op-ex. In terms of where we are buying $AI, that will depend upon the PFP, but I'll consider the TGS or TPS/BBP to get long.
I'll share our live trade in real time with our members of the Benzinga Option School or Trading Waves, which you can join now for the Black Friday special. I hope to see you there soon – and happy Thanksgiving!
Unlock daily trade setups, insider stock picks, and real-time alerts with Benzinga Edge. Don't wait—our Black Friday sale is live now for the lowest price of the season!
© 2025 Benzinga.com. Benzinga does not provide investment advice. All rights reserved.
Trade confidently with insights and alerts from analyst ratings, free reports and breaking news that affects the stocks you care about.