Zinger Key Points
- Semiconductor stocks have been a leading indicator for decades.
- The recent divergence between SMH and S&P 500 may lead to a significant decline.
- With stocks plunging, steady income is key. Tim Melvin & Ryan Faloona reveal dividend stocks and deep-value plays on April 8. Reserve your spot now.
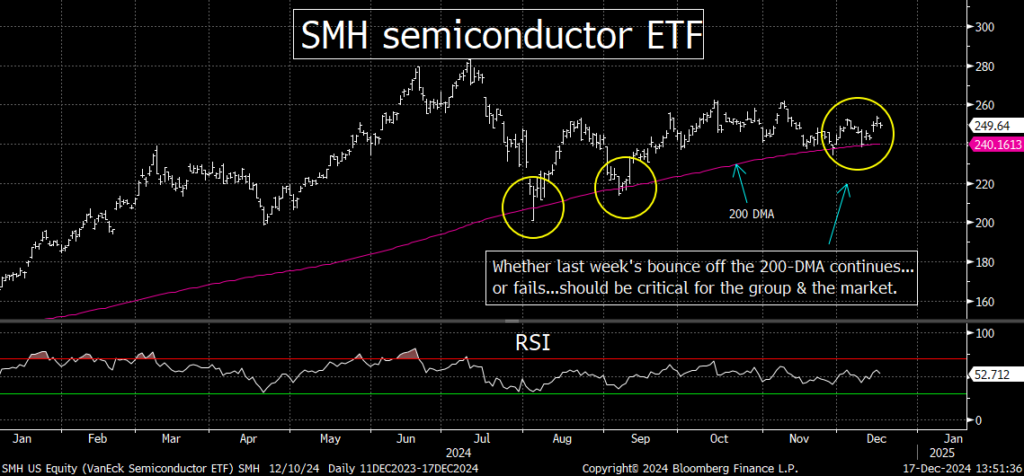
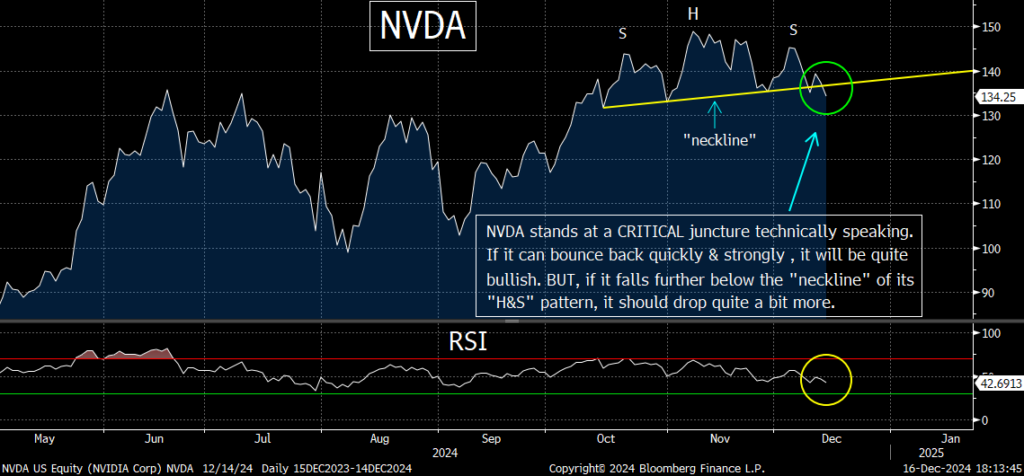
In one of my daily comments last week, I highlighted how the SMH semiconductor ETF was testing a key support level. Well, it bounced off that level a bit on Friday. Whether that bounce continues or fails should be extremely important for this consequential leadership group. Now we have Nvidia testing a critical level as well.
This is something all investors need to watch next week!
As I have shown many times in the past, semiconductor stocks have either been a leading indicator for the broad stock market, or a coincident indicator, for many decades. They have not been a lagging indicator. Therefore, the odds that the recent divergence that has developed between the SMH and the S&P 500 will be resolved with a significant bounce back in the SMH are quite low. Instead, the odds are quite high that it will be resolved with a decline in the S&P at some point, and given what took place in 2018, this might begin quite soon.
That's right, the divergence that exists today between the SMH and the S&P 500 is very reminiscent of what took place in 2018. Back then, they both made nice new highs in the spring, but they began to diverge at that point. As the S&P made a new high over the summer, the SMH did not.
In fact, it slid lower, and then continued to underperform the S&P over the next six months. This year, the SMH and S&P made new highs during the summer. The S&P was able to push back to a new high a few months later, but the SMH has not. It slid quite a bit lower during the late-summer months, and has underperformed the S&P 500 ever since.
Now, it's almost six months since this divergence began to develop, just like it was in 2018, when the situation began to resolve itself. Back then, the SMH went from merely "underperforming" to actually declining in a meaningful way. When that took place, the rest of the stock market followed the chip stocks lower, and the result was a 19% decline in the S&P 500.
Of course, just because it's almost six months later this time around, does not mean that the same thing is going to happen after six months. We're going to have to see actual evidence that the SMH is starting to break down in a meaningful way before we can focus on these similarities. However, if the SMH falls much further from where it is trading right now, that will indeed raise concerns that the chip stocks are beginning a significant path lower.
[Get Your 30-Minute Trading Advantage, Free for 2 Weeks]
As you can see from the first chart below, the SMH tested its 200-DMA right last week:

(I have highlighted how this ETF has been flirting with this number recently, but now it’s actually testing that level.) Thankfully, it was able to bounce off that line on Friday, but it needs to see some more upside follow-through to confirm that the 200-DMA is indeed going to provide strong support, just like it has several times over the past few months. (I'd also note that the 200-DMA is also the trend-line from the August lows, so that's another reason to worry about a break below that line.)
In other words, if it rolls back over quickly, and takes out that 200-DMA in any meaningful way, it's going to be a very bearish development for this key leadership group. So, the SMH still stands at a key technical juncture.
The one stock that will very likely tell us what happens in the chip group going forward is Nvidia (NVDA). (It was great that Broadcom (AVGO) was able to give the group a nice lift on Friday, but NVDA actually closed lower on the day.) Therefore, the next significant move in NVDA should be extremely important, given that it's more than 21% of the SMH.
The reason I’m highlighting this situation for NVDA is that it stands at a critical juncture on a technical basis. The stock has formed a "head and shoulders" pattern over the past three months and it broke slightly below the "neckline" of that pattern on Friday:

So, if it falls further next week, and breaks more meaningfully below that neckline, it's going to be very bearish for this key stock, because "head and shoulders" patterns are one of the most bearish ones in technical analysis.
However, I also need to point out that one of the most bullish items we can see in technical analysis is a "failed head and shoulders" pattern. Therefore, if NVDA can bounce back sharply and quickly next week, it should be something that adds to Friday's bounce in the SMH. That would likely lead to more the upside momentum in the overall tech sector, and the broad stock market as well.
In other words, even though NVDA was not overly important for the stock market last week, it should return to its standing as the most important stock in the market next week, and I'll be watching its movements extremely closely.
Benzinga Pro alerts have led to major gains, like 270% on BLPH and 147% on CRBP. Access this market-shaping news before anyone else with Benzinga Pro's free two-week trial. Click here to start now.
Image via Shutterstock
© 2025 Benzinga.com. Benzinga does not provide investment advice. All rights reserved.
Trade confidently with insights and alerts from analyst ratings, free reports and breaking news that affects the stocks you care about.