Zinger Key Points
- NVO stock remains in a strong bearish downtrend, trading below key moving averages and technical resistance levels.
- Oversold conditions signal potential short-term bounce, but the broader bearish trend suggests continued downward pressure.
- Get real-time earnings alerts before the market moves and access expert analysis that uncovers hidden opportunities in the post-earnings chaos.
Novo Nordisk A/S NVO is seeing its stock spiral downwards, with shares plummeting 20% early Friday following the release of Phase 3 trial data.
While the headlines point to a new trial result that failed to meet expectations, the technical analysis reveals a deeper, more concerning picture of the stock’s momentum.
Read News Details: Novo Nordisk’s Hybrid Weight Loss Drug Falls Short On Expectations, Stock Plunges

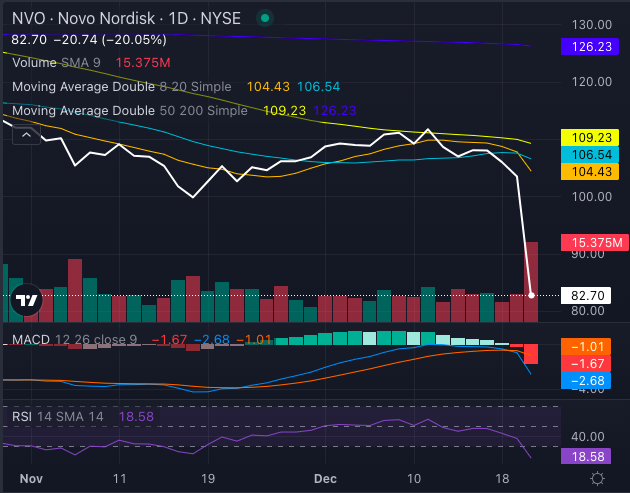
Chart created using Benzinga Pro
NVO Stock Has Bearish Signals Across The Board
NVO's charts are filled with clear signs of weakness, and the technicals are currently dominated by bearish trends.
Here’s a breakdown of what the indicators are signaling:
- Exponential Moving Averages (EMAs): NVO stock is trading below its five, 20, and 50-day EMAs, marking a distinct downtrend. A sustained move below these averages generally indicates a lack of bullish momentum and suggests further downside potential in the near term.
- Simple Moving Averages (SMAs): Novo Nordisk's stock price of $82.70 is significantly below its eight-day simple moving average (SMA) of $104.43, 20-day SMA of $106.54 and 50-day SMA of $109.23. With all these moving averages acting as resistance levels, the bearish sentiment remains entrenched. Furthermore, the price is well below the 200-day SMA of $126.23, reinforcing the ongoing downtrend.
- MACD (Moving Average Convergence Divergence): The MACD reading of a negative 2.68 is a clear sign of negative momentum. A negative MACD indicates that the short-term moving averages are below the long-term averages, further validating the lack of bullish pressure and signaling that the stock could remain under selling pressure.
- RSI (Relative Strength Index): NVO's RSI is currently at 18.58, a deeply oversold level. While this could suggest that the stock is due for a short-term bounce, it also points to how overextended NVO stock has become to the downside. Historically, an RSI this low can signal that a reversal is due, but with the broader trend still bearish, any bounce might be short-lived and met with renewed selling.
For now, NVO stock is in a strong technical downtrend, with little immediate indication that it will break free from the selling pressure.
Read Next:
Photo: Shutterstock
© 2025 Benzinga.com. Benzinga does not provide investment advice. All rights reserved.
Trade confidently with insights and alerts from analyst ratings, free reports and breaking news that affects the stocks you care about.