Zinger Key Points
- Official inflation numbers show increase, stoking fears of Fed not lowering rates & NVDA dip.
- Get two weeks of free access to pro-level trading tools, including news alerts, scanners, and real-time market insights.
Official inflation numbers came out yesterday morning, showing an increase across the board. This has stoked fears the Fed may not decrease rates and may have to even increase rates in an already fragile environment.
Pretty much every ticker across the board dipped on the news, while some bounced back a little later. NVDA dropped from $134 to $129 on the news and has since bounced back above $130. But it's barely holding on. The question on traders' minds is "is it time to dip buy NVDA?"
Let's dive into how my PFP system is looking at NVDA and how we're looking to trade it.
Options Positioning in NVDA
Looking at the positional chart below (notional gamma) for NVDA, we can see $130 is a massive level. There are definitely more calls than puts at $130 (blue line) but the largest amount of put gamma (for the February options expiration) is at $130.
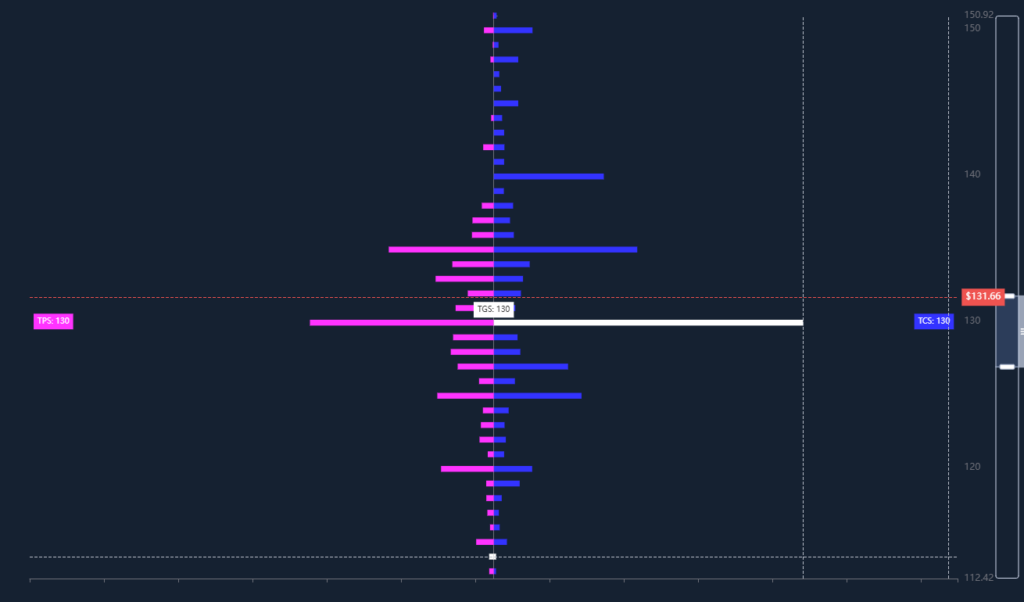
This makes the $130 level the TGS (top gamma strike) and bulls will want to hold this to retain a bullish bias and a modicum of control.
If NVDA can hold and ideally regain some ground, then this favors staying bullish on NVDA, so if you don't have a bullish position, and feel $130 will hold, this is your line in the sand to get long.
On the other side, if we start to close below $130, puts will be mostly in control. This lends itself to more volatility and bears having a greater influence on the price action. Thus, if you want to establish a bearish position, you'd want to see a daily close under $130 to get bearish. We see almost the same fuel at $125 and $120, so those would be our downside targets if we got bearish.
Option Flows for NVDA
As I'm writing this on Wednesday morning, the NVDA option flows are neutral to mildly bearish with traders selling a mild amount of calls (-17M notional deltas) and buying a small amount of puts (-9M notional deltas). This is a very modicum of bearish flows.
Traders simply aren't hitting the gas to buy hand over fist, but they're not establishing seriously bearish positions (yet).
I think a daily close under $130 likely ignites more bearish positions, but this is not the flow I want to see to buy the dip.
Price Action in NVDA
Looking at the chart below, we can see the impulsive selling pre-market from the core inflation print, and a corrective bounce since. This corrective bounce is not the most inspiring, and clearly matches the lackluster buying response in the option flows.
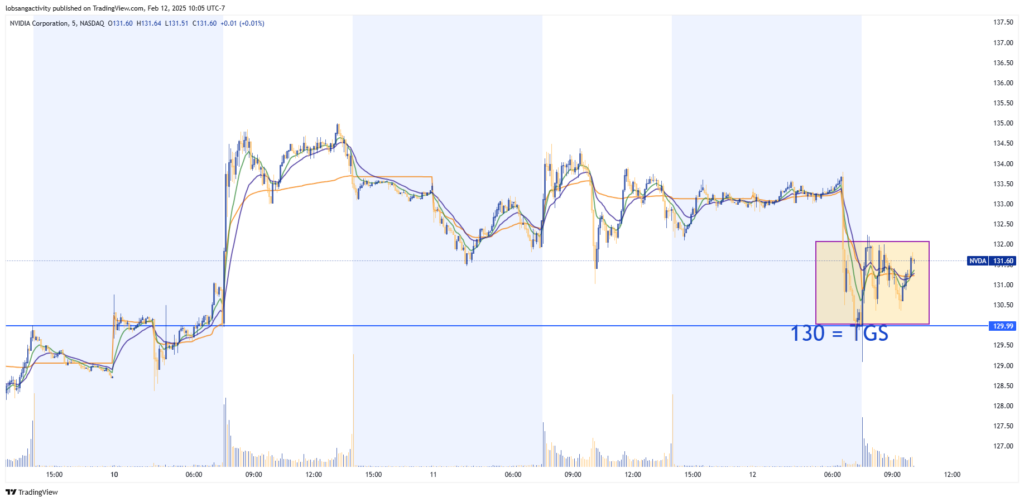
5-minute NVDA chart
$130 is the TGS, so it's not surprising to see a fair dinkum of price action around there. Regaining $133.5 helps as it would have recovered the CPI losses while losing $130 on a daily closing basis could add fresh technical selling.
How We're Trading NVDA
I'm watching this corrective bounce very carefully for subtle clues which way it wants to break, but it's a fragile position for bulls while inside this corrective structure. Flows haven't shown a major bias yet, so I think the best thing is to stay put and look for conviction in the option flows and a break of the corrective structure.
I'll share our live trade ideas in real time with our members of the Benzinga Option School or Trading Waves, so make sure to join and see how I'm trading it. I hope to see you there soon.
© 2025 Benzinga.com. Benzinga does not provide investment advice. All rights reserved.
Trade confidently with insights and alerts from analyst ratings, free reports and breaking news that affects the stocks you care about.

