


Zinger Key Points
- HPE's Death Cross signals further downside, despite AI-driven optimism from its Nvidia collaboration.
- Technical weakness outweighs AI hype, as HPE remains in a strongly bearish trend with key resistance ahead.
- Feel unsure about the market’s next move? Copy trade alerts from Matt Maley—a Wall Street veteran who consistently finds profits in volatile markets. Claim your 7-day free trial now.
Hewlett Packard Enterprise Co. HPE investors have a technical red flag flashing—the dreaded Death Cross.
The stock has tumbled 23.24% year-to-date and 18.78% in the past month, and now, a bearish crossover of the 50-day and 200-day simple moving averages suggests more downside could be ahead.
While HPE's AI collaboration with Nvidia Corp NVDA is generating buzz, the technicals tell a different story.
Read Also: Nvidia Stock Climbs As AI, Tariff News Spark Buying Interest
HPE Stock: A Strongly Bearish Trend
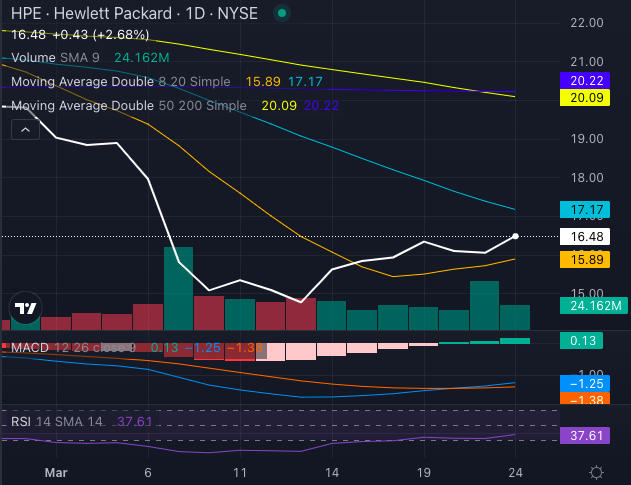
Chart created using Benzinga Pro
HPE stock, at $16.48, trades below its five, 20 and 50-day exponential moving averages, indicating a strong bearish trend despite slight buying pressure.
The eight-day simple moving average (SMA) at $15.89 provides a bullish signal, but the broader outlook remains bleak:
- 20-day SMA: $17.17 (bearish signal)
- 50-day SMA: $20.09 (bearish signal)
- 200-day SMA: $20.22 (bearish signal)
- Moving Average Convergence Divergence (MACD): negative 1.25 (bearish momentum)
- Relative Strength Index (RSI): 37.61 (nearing oversold territory, but not yet in bounce territory)
AI Buzz Vs. Bearish Technicals
Hewlett Packard recently announced new enterprise AI solutions in partnership with Nvidia, aiming to accelerate AI adoption with improved performance, security, and power efficiency.
While CEO Antonio Neri highlights AI's transformative potential, technical indicators suggest the stock faces near-term selling pressure.
Investor Takeaway
Despite AI-driven optimism, HPE stock's Death Cross and continued technical weakness caution against bullish bets. The stock's downward momentum remains intact, and traders should watch key resistance levels before considering an entry.
Until Hewlett Packard proves it can capitalize on AI hype with tangible results, investors should brace for turbulence.
Read Next:
Image: Shutterstock
Edge Rankings
Price Trend
© 2025 Benzinga.com. Benzinga does not provide investment advice. All rights reserved.
Trade confidently with insights and alerts from analyst ratings, free reports and breaking news that affects the stocks you care about.

