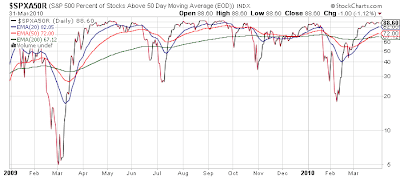
% of Stocks Over 50 Day Moving Average Reaching Rally Extremes in both S&P 500 and NASDAQ 100
Obviously we are sitting at some very overbought levels. Below are the % of stocks over their 50 day moving averages in both the S&P 500 and NASDAQ 100. The [broader] NASDAQ Composite is not so extreme, but since the whole NASDAQ is essentially Apple (AAPL), Google (GOOG), Amazon.com (AMZN), Priceline (PCLN), and Baidu.com (BIDU), I don't think the computers care much about what else in the index.
[click to enlarge]
What struck me by these charts was how QUICKLY so much damage was done in late January to mid February. I remember when up to the last week of that selloff every stock but 4 I owned was stopped out as it broke support (in most cases, the 50 day moving average) and then in the flush down to fill gaps created in 2009 on the S&P 500, even those 4 broke support if only for a few days.
Of course since then, it's been non stop fun and joy. As long as you drink Kool Aid and never sell a stock assuming the market can fall over 0.5%.
And with that I bring you the broken record "We're overdue for a correction, even of the 3-5% variety".
Nah, April Fool's! We're rallying straight through 2012 or S&P 2000 - whichever comes first!
The preceding article is from one of our external contributors. It does not represent the opinion of Benzinga and has not been edited.
© 2024 Benzinga.com. Benzinga does not provide investment advice. All rights reserved.


