


Zinger Key Points
- The recent global financial crisis was first sparked by Lehman Brothers' bankruptcy in September 2008.
- The S&P 500 typically underperforms during midterm election years in September.
- Feel unsure about the market’s next move? Copy trade alerts from Matt Maley—a Wall Street veteran who consistently finds profits in volatile markets. Claim your 7-day free trial now.
Investors fooled by the mid-summer bear market relief rally may want to sit the month of September out, as it is historically the worst performing month in the year. Let’s get to the data.
Jeffrey Hirsch, the author of "The Stock Trader’s Almanac," uses historical patterns and market seasonality in conjunction with fundamental and technical analysis to reduce risk and increase returns for investors.
Hirsch took to Twitter Inc TWTR Thursday to warn investors of the potential dangers of investing during the month of September.
“Selling in August before this infamous weak seasonal period is not a new thing,” he said. “August is the second worst month since 1987. We are still in a bear market. Inflation is still high.”
Read more: Nvidia, AMD Shares Tumble As US Slaps Export Curbs on Top AI Chips To China: What's At Risk Here?
September is historically the worst performing month for the markets. Typically, it is a down month for stocks because fund managers tend to sell underperforming positions as the end of the third quarter approaches, according to the Almanac.
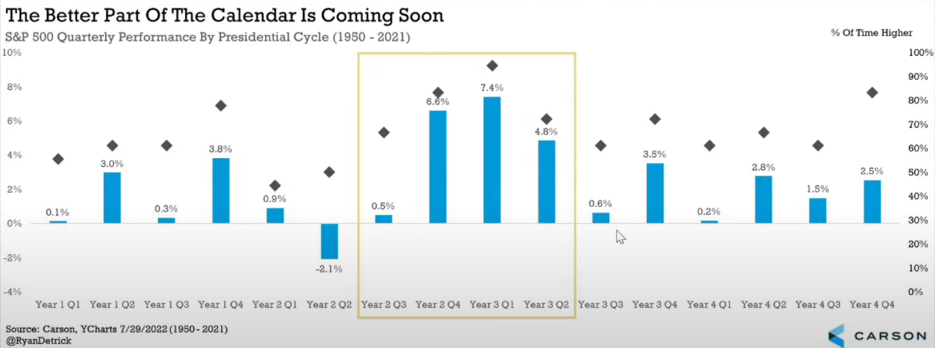
Additionally, this is a midterm election year. The S&P 500 typically underperforms during midterm years in September, and the period sits at the end of the weak spot of the four-year presidential cycle.
September S&P Returns: Midterm years marked with ‘M’ New elect marked with ‘N’
- 2022: -1.16% M
- 2021: -4.76% N
- 2020: -3.92%
- 2019: 1.72% M
- 2018: 0.43%
- 2017: 1.93% N
- 2016: -0.12%
- 2015: -2.64% M
- 2014: -1.55%
- 2013: 2.97% M
- 2012: 2.42%
- 2011: -7.18% M
- 2010: -4.74%
- 2009: 3.57% N
- 2008: -9.08%
The Almanac gathers that September’s improvement over the last 15 years has moved the month up to seventh place for the returns in the index, with an average gain of 3.3% — but Hirsch makes clear that this is reflective of the current trends during a predominant and strong secular bull run for most of the last 15 years, barring the 2020 COVID crash.
Speculation aside, September seems to have a peculiar propensity for market catastrophes. The 1929, 1987 and 2008 crashes started in September. The recent global financial crisis was first sparked by Lehman Brothers' bankruptcy in September 2008.
Additionally, options traders appear to believe that future suffering may be worse. On Aug 19, the quantity of active bearish option contracts on the tech-heavy Invesco QQQ Trust Series 1 QQQ soared to the greatest level since the aftermath of the dot-com bust.
The Last Word: Vaporizing the returns from the nearly nine-week run that gave more than 17% to investors from mid-June to mid-August, many are now wondering whether indices will challenge the June lows after digesting recent hawkish remarks from Fed officials who show no indications of easing off on interest rate hikes.
“With history as our guide & current readings tame,” Hirsch said, “we're inclined to heed the seasonal cautions that surround worst month and Weak Spot. While we await to hear more from the Fed & what they do with rates next FOMC meeting on September 21.”
Edge Rankings
Price Trend
© 2025 Benzinga.com. Benzinga does not provide investment advice. All rights reserved.
Trade confidently with insights and alerts from analyst ratings, free reports and breaking news that affects the stocks you care about.

