Zinger Key Points
- The negative reaction to Dollar Tree's earnings print caused the stock to fall under the 200-day SMA.
- Bullish traders will want to watch for eventual consolidation to occur on decreasing volume to re-evaluate for patterns.
- China’s new tariffs just reignited the same market patterns that led to triple- and quadruple-digit wins for Matt Maley. Get the next trade alert free.
Dollar Tree Inc DLTR was plunging about 10% on Tuesday despite printing a third-quarter earnings beat.
The discount retailer said it expects fourth-quarter profits to come in softer than previously anticipated and raised its revenue outlook for that quarter.
The Chesapeake, Virginia-based company reported quarterly earnings of $1.20 per share on revenue of $6.94 billion, which beat average analyst estimates of earnings of $1.18 per share on revenue of $6.84 billion.
See Also: Dollar Tree Shares Are Sliding - What's Going On?
Dollar Tree expects fourth quarter and full year 2022 revenues to come in between $7.54 billion and $7.68 billion and $28.14 billion to $28.28 billion, respectively.
Following the results, Telsey Advisory Group analyst Joseph Feldman maintained an Outperform rating on the stock and reiterated a price target of $170.
“Dollar Tree executed well in 3Q22, although the 4Q22 outlook is mixed, with stronger sales but softer profits. Broadly, we continue to believe the company remains well-positioned to gain market share, given its convenient locations, value merchandise, and transformative initiatives,” Feldman said in a note.
Dollar Tree said it now expects full-year EPS to come in at the lower half of its range, between $7.10 - $7.40, against the consensus of $7.32. Like many retailers, Dollar Tree is feeling the pressures of stubbornly high inflation.
The weakened EPS guidance spooked traders and investors and caused the stock to gap down 6.57%.
Want direct analysis? Find me in the BZ Pro lounge! Click here for a free trial.
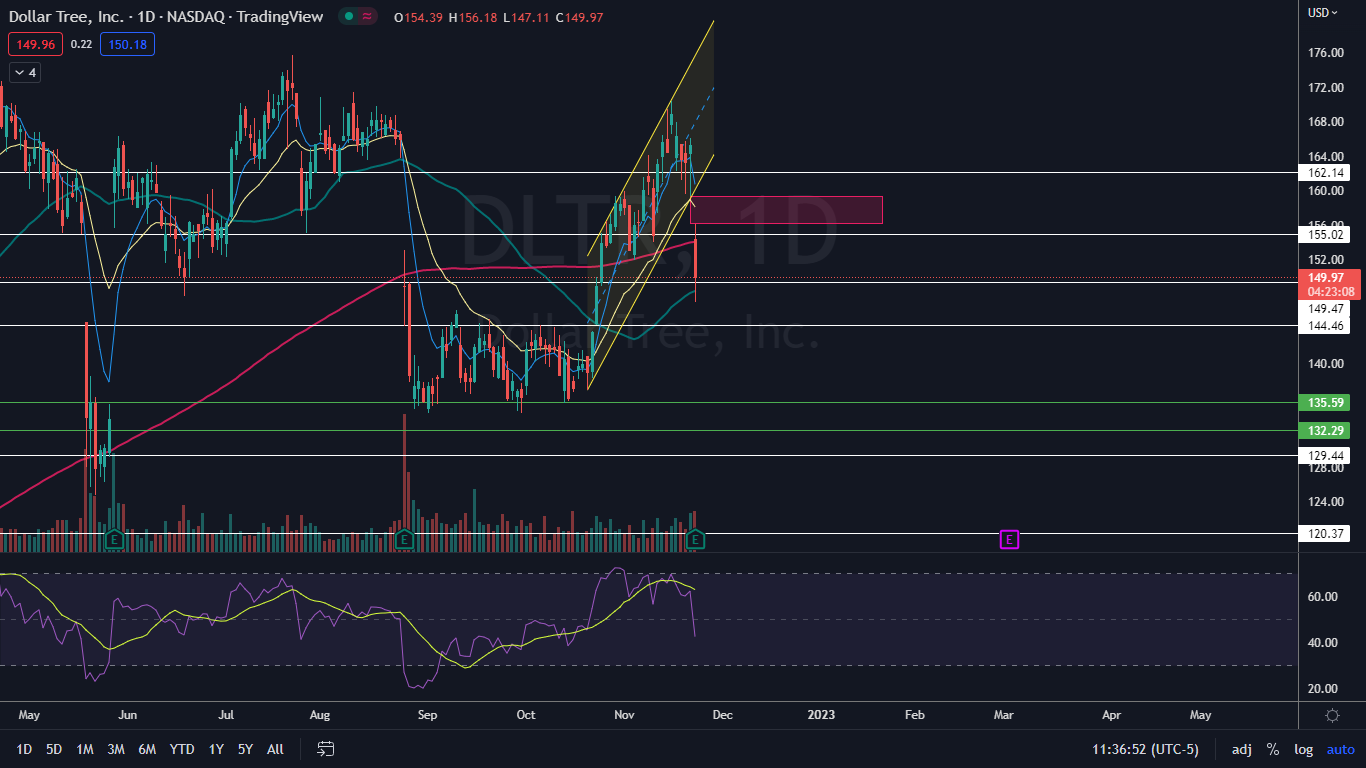
The Dollar Tree Chart: The gap down and subsequent plunge lower on Tuesday caused Dollar Tree to lose support at the 200-day simple moving average (SMA), throwing the stock into bear territory. Dollar Tree then fell to the 50-day SMA and bounced up from the level, indicating the bulls want to defend the area as support.
- The big slide lower caused Dollar Tree to break down bearishly from a rising channel pattern on the daily chart, which the stock began trading in on Oct. 20. A rising channel pattern is considered to be bullish until a stock breaks down from the lower ascending trendline on higher-than-average volume.
- The higher-than-average volume on Tuesday indicates the bears are currently in control of the stock, Bullish traders will want to watch for Dollar Tree to eventually start consolidating sideways on decreasing volume over the next few days, to allow a new pattern to develop.
- Dollar Tree has resistance above at $155.02 and $162.14 and support below at $149.47 and $144.46.
 See Also: Best Buy Q3 Earnings Top Estimates; Resumes Stock Buyback
Edge Rankings
Price Trend
© 2025 Benzinga.com. Benzinga does not provide investment advice. All rights reserved.
date | ticker | name | Price Target | Upside/Downside | Recommendation | Firm |
|---|
Trade confidently with insights and alerts from analyst ratings, free reports and breaking news that affects the stocks you care about.