Zinger Key Points
- Homebuilder stocks down 10% this month, first correction since September 2023.
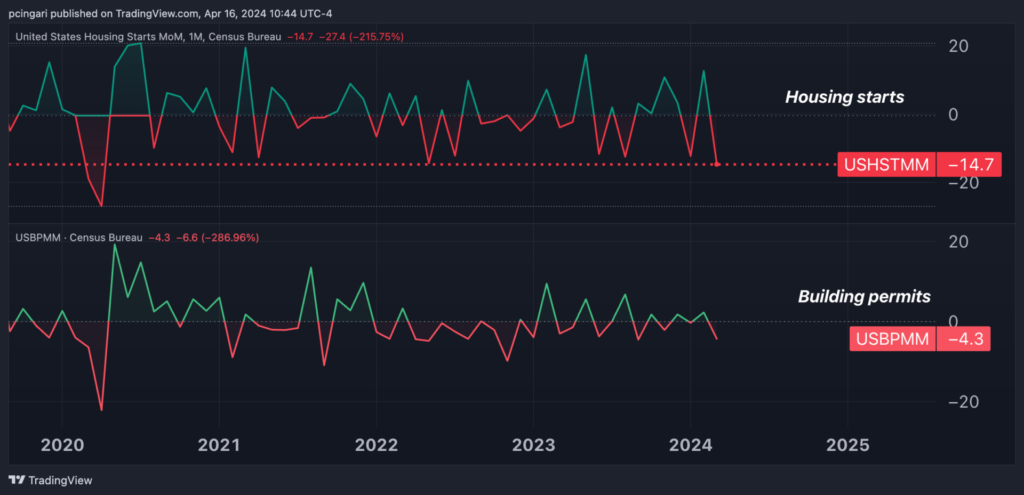
- U.S. housing starts plummeted 14.7% in March, the sharpest drop since April 2020.
- China’s new tariffs just reignited the same market patterns that led to triple- and quadruple-digit wins for Matt Maley. Get the next trade alert free.
Homebuilder stocks face sharp declines as the SPDR Homebuilders ETF XHB drops 1.8% in Tuesday’s session, hitting its lowest level since Feb. 26, 2024, amid negative economic data.
From the start of the month, this performance gauge has fallen approximately 10%, marking the first market correction since September 2023 after a significant 60% rally in the six months leading up to late March.
Tuesday’s worst performers among U.S. homebuilder stocks were Installed Building Products, Inc. IBP, TopBuild Corp. BLD, Dream Finders Homes, Inc. DFH
Sharp Decline in Housing Starts Signals Market Cooling
In the U.S., housing starts in March 2024 saw a dramatic month-over-month decrease of 14.7%, reaching an annualized rate of 1.321 million.
This figure not only represents the steepest drop since April 2020, but also sits substantially below the anticipated 1.48 million, according to data from the U.S. Census Bureau.
The decline spans across single-family homes, which decreased by 12.4% to 1.022 million, and units in buildings with five or more units, which fell by 20.8% to 290,000.
Regional Breakdown:
- Northeast: Decreased by 36% to 80,000
- Midwest: Decreased by 23% to 157,000
- South: Decreased by 17.8% to 736,000
- West: Increased by 7.1% to 348,000
Building Permits Also Show Decrease
March 2024 building permits dropped by 4.3% to a seasonally adjusted annual rate of 1.458 million, reversing a 2.3% rise in February and missing forecasts of 1.514 million.
This marks the lowest level since July of the previous year. Single-family authorizations also declined by 5.7% to a five-month low of 973,000.
Regional Insights:
- South: Slight decrease of 0.6% to 771,000
- Midwest: Sharp decrease of 14.7% to 197,000
- Northeast: Steep decline of 20.8% to 160,000
- West: Gained 5.1% to 330,000
Read also: Intel and Nvidia Reveal New Products for China, Adapt AI Chip Strategies in Response to US Sanctions
Analyst Insights: Slowing Growth and Future Concerns
Jeffrey Roach, chief economist for LPL Financial, highlights that housing starts dropped in March and “are starting to show cracks in the pace of growth.”
The economist expects significant slowing, particularly in multifamily construction. He warns that the decline in building permits suggests a future slowdown in building activity.
“Housing construction is poised to slow as potential homebuyers indicate now is a poor time to buy a home. Investors should expect residential investment becoming a drag on GDP growth in the coming quarters,” Roach wrote.
Bill Adams, chief economist for Comerica Bank, points out the impact of high interest rates, especially on the credit-intensive multifamily segment. Despite a year-over-year increase in starts and permits in the first quarter, the sector shows clear signs of cooling due to rising borrowing costs.
“In the first quarter as a whole, housing starts rose 2.1% from a year earlier but fell an annualized 17.5% from the fourth quarter of 2023. Building permits rose 4.6% on the year in the first quarter and were up 1.1% annualized on the quarter,” he stated.
The multifamily segment of homebuilding is experiencing the most significant slowdown. Typically, these developments are intended for leasing and depend on long-term debt financing.
However, as the Federal Reserve has increased interest rates, the cost of this financing has risen sharply.
Bottom line, the housing market faces continued pressure from rising mortgage rates and economic uncertainty, and the homebuilding sector’s recent downturn might signal a broader cooling.
With experts predicting residential investment to drag on GDP growth, the market may not stabilize until the Federal Reserve adjusts its monetary policy.
Homebuilders and investors should brace for challenging quarters ahead as potential homebuyers are increasingly viewing this period as a poor time to buy a home.
Chart: Housing Starts and Building Permits (% month-over-month)

Image generated using artificial intelligence via Midjourney.
Edge Rankings
Price Trend
© 2025 Benzinga.com. Benzinga does not provide investment advice. All rights reserved.
date | ticker | name | Price Target | Upside/Downside | Recommendation | Firm |
|---|
Trade confidently with insights and alerts from analyst ratings, free reports and breaking news that affects the stocks you care about.