
Zinger Key Points
- As Shopify is set to report Q1 earnings on Wednesday, charts indicate a bullish reversal for the stock.
- Analysts, however, foresee downside ahead.
- Pelosi’s latest AI pick skyrocketed 169% in just one month. Click here to discover the next stock our government trade tracker is spotlighting—before it takes off.
Shopify Inc SHOP is reporting its first-quarter earnings on Wednesday. Wall Street expects 17 cents in EPS and $1.845 billion in revenues as the company reports before market hours.
The stock is up 18.44% over the past year but down 2.04% YTD.
Let’s look at what the charts indicate for Shopify stock and how the stock currently maps against Wall Street estimates.
Charts Indicate Bullish Reversal For Shopify Stock Ahead Of Q1 Earnings
The current technical trend for Shopify stock is strongly bullish, hinting at a bullish reversal from the recent downtrend.

The share price is above its 8-, 20-, and 50-day simple moving averages, indicating buying pressure and suggesting a positive outlook for future bullish movement.
Specifically, the 8-day simple moving average (SMA) is at $73.15, the 20-day SMA is at $71.60, the 50-day SMA is $74.72, and the 200-day SMA is $68.47, all below the current stock price of $76.95, indicating bullish momentum.
However, the Moving Average Convergence Divergence (MACD) indicator, at 0.01, has just recovered from the negative territory. This potentially indicates a change in the stock’s current trend, which was bearish recently. Note that the MACD crossed above the signal line to reach this positive territory, reinforcing bullish signals.
The Relative Strength Index (RSI) is 60.04, indicating that the stock is neither overbought nor oversold. However, it is gradually treading upwards towards the overbought territory at and beyond 70.
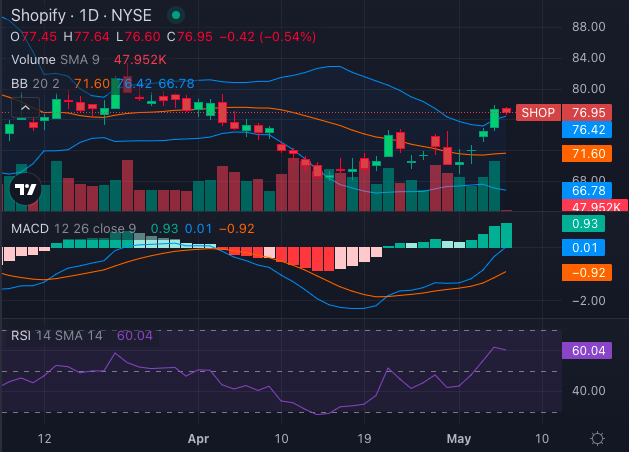
Additionally, the Bollinger Bands have Shopify stock breaking out of the upper bullish band, after surging past the lower (bearish) band to the upper, recently.
Overall, the technical indicators for Shopify stock indicate positive momentum and a bullish reversal for Shopify stock with the moving averages and the oscillators both giving out bullish signals.
Also Read: Here’s How Much $100 Invested In Shopify 10 Years Ago Would Be Worth Today
Shopify Analysts See Downside Ahead
Ratings & Consensus Estimates: The consensus analyst rating on Shopify stock stands at a Buy currently with a price target of $63.17. The most recent analyst ratings for Shopify stock were released by Benchmark, Citigroup and Morgan Stanley for April 19 and onwards. The average price target from these three analysts is $63.33, implying a -17.70% downside potential for the stock.
SHOP Price Action: Shopify stock was trading at $77.32 a share at the time of publication.
Photo: Shutterstock
Edge Rankings
Price Trend
© 2025 Benzinga.com. Benzinga does not provide investment advice. All rights reserved.
Trade confidently with insights and alerts from analyst ratings, free reports and breaking news that affects the stocks you care about.

