Zinger Key Points
- Utilities have outperformed all S&P 500 sectors this year with a 13.6% gain.
- Surging electricity needs from data centers are giving utilities a significant boost, says strategist Adam Turnquist.
- Get two weeks of free access to pro-level trading tools, including news alerts, scanners, and real-time market insights.
Utilities rarely steal the spotlight in market headlines, often overshadowed by the exponential growth of tech giants and the emergence of artificial intelligence leaders.
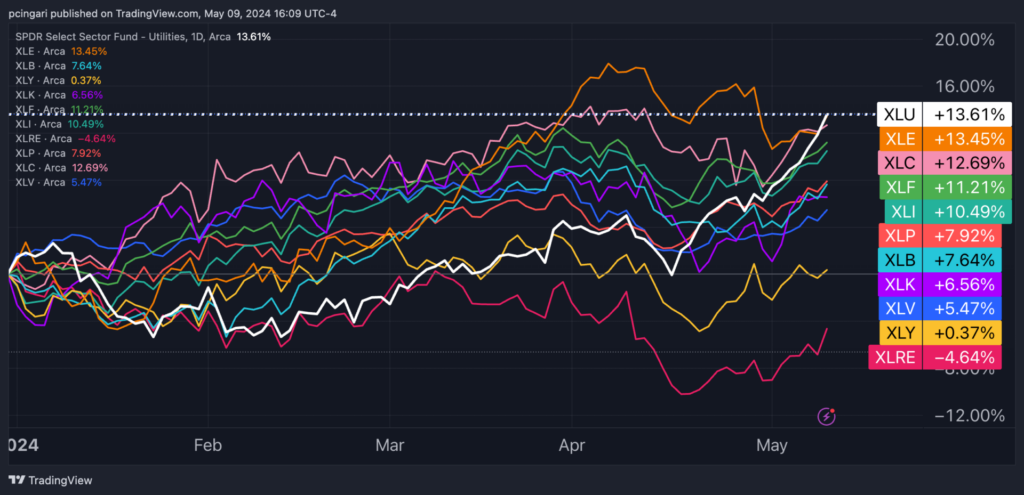
Despite the lack of attention, the utilities sector, represented by the Utilities Select Sector SPDR Fund XLU, has quietly achieved its seventh consecutive session in the green on Thursday, surpassing the performance of every other sector in the S&P 500 since the beginning of the year.
With a year-to-date performance of approximately 13.6%, utilities are edging ahead of energy, tracked by the Energy Select Sector SPDR Fund XLE, and doubling the returns of the technology sector, represented by the Technology Select Sector SPDR Fund XLK.
Chart: Utilities Outperform Every S&P 500 Sector Year-To-Date

The true rally of utilities seems to have started less than a month ago. Since April 17, this sector has recorded 15 out of 17 sessions in the green, indicating a significant shift in investor sentiment.
Chart: Utilities Rise By 14% Since Mid-April

Utilities Regain Power, Expert Says
“Investors are starting to kick the tires on the sector as a potential derivative play to the AI boom,” Adam Turnquist, chief technical strategist for LPL Financial, wrote in a note.
According to the International Energy Agency (IEA), global electricity demand from data centers could soar to between 650-1,000 terawatt-hours (TWh) by 2026, up from 460 TWh in 2022.
The expert highlighted that surging power demand among data centers could provide a major tailwind for the utilities sector.
Also read: AI Data Centers Drive Electricity Demand: Goldman Sachs Picks 16 Stocks To Play The Trend
The focus on data centers has also dominated recent earnings calls. For instance, Dominion Energy Inc. D powers Northern Virginia, home to the largest data center market globally, where approximately 70% of global internet traffic passes through.
On its May 2 earnings call, Dominion highlighted a significant uptick in data center demand, noting changes in the scale and speed of requests.
Looking at technicals, Turnquist highlighted that the S&P 500 Utilities Sector vs. S&P 500 ratio chart, which tracks trend direction and strength, recently reversed its own downtrend and moved above its 200-day moving average for the first time in over a year. This suggests potential for further outperformance by the utility sector.
Chart: Relative Performance Of Utilities Against S&P 500 Surges Above 200-Day Average

Read now: Investors Flock To Lower-Cost Vanguard S&P 500 ETF: Is It Time To Switch From SPY To VOO?
Photo via Shutterstock.
© 2025 Benzinga.com. Benzinga does not provide investment advice. All rights reserved.
date | ticker | name | Price Target | Upside/Downside | Recommendation | Firm |
|---|
Trade confidently with insights and alerts from analyst ratings, free reports and breaking news that affects the stocks you care about.