Zinger Key Points
- SoFi Technologies' stock surges 53.04% over the past year but faces mixed technical signals, including an overbought RSI.
- Analysts are bullish on SoFi, with a consensus buy rating and price targets suggesting potential upsides of 9.36% to 70%.
- Our government trade tracker caught Pelosi’s 169% AI winner. Discover how to track all 535 Congress member stock trades today.
SoFi Technologies Inc SOFI, a prominent player in the online personal finance and banking sector, has been on a rollercoaster ride in the stock market over the past year.
The San Francisco-based company provides a wide array of financial products and services, including student loan refinancing, mortgages, personal loans, credit cards, investing and banking, accessible through both mobile and desktop interfaces.
SoFi Stock Analyst ‘As Bullish As Ever’
SoFi stock was recently applauded by Mizuho Securities analyst Dan Dolev. Coming out of management meetings with SoFi executives, Mizuho analysts were “as bullish as ever.”
The analyst highlighted healthy internal indicators and noted the company is being cautious about personal loan growth due to less upbeat external indicators. The DQ loan sale has strong economics, and life of loan losses are on track, despite variability from new shorter-duration loans.
Also Read: What’s Going On With SoFi Technologies Stock After Earnings?
Stock Performance Dynamic: What Do The Price Charts Say?
SoFi’s stock performance has been quite dynamic, with a 53.04% increase over the past year, contrasting with a -26.63% year-to-date decline. These fluctuations reflect the volatile nature of the market and the company’s response to various economic factors.
Let’s delve into the company’s stock price chart, and analyst ratings to understand its current position and potential for investors.

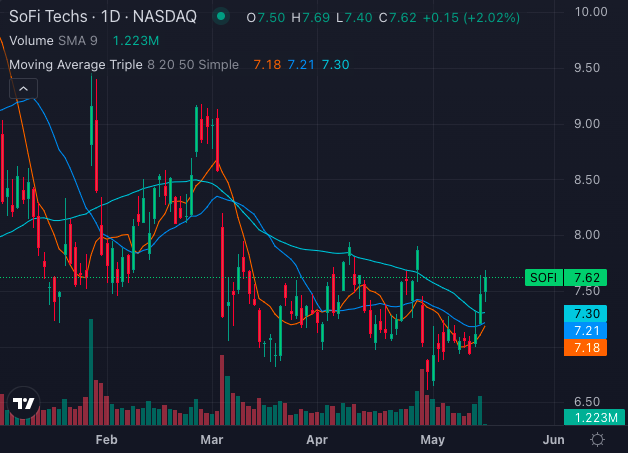
The price chart analysis for SoFi stock reveals a mixed picture. The stock is currently experiencing buying pressure, with its 8-day simple moving average (SMA) at $7.18, 20-day SMA at $7.21 and the 50-day SMA at $7.30, all suggesting a bullish signal.
However, the 200-day SMA at $8, trading above the SoFi stock price of $7.62, indicates a bearish signal.

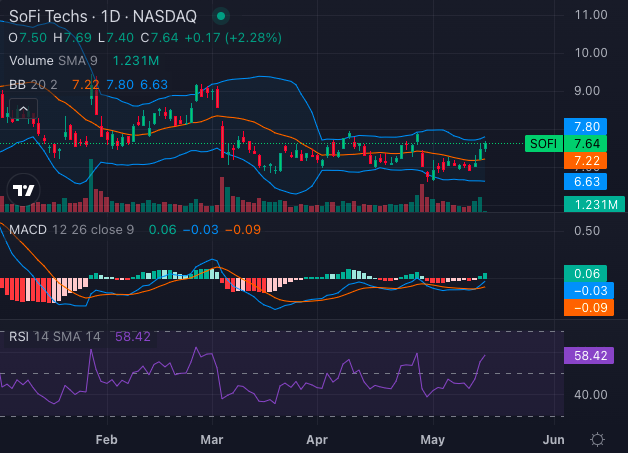
Similarly, the Moving Average Convergence Divergence (MACD) indicator stands at -0.03, suggesting a bearish momentum while the Relative Strength Index (RSI) of 58.42 indicates that SoFi stock is neither overbought nor oversold.
The Bollinger Bands have SoFi stock oscillating between the upper (bullish) and lower (bearish) band, giving mixed signals. Recent stock price movements, however, indicate a surge upwards within the upper band — a positive indication.
Overall, the technical indicators remain divided in their implication for SoFi stock.
SoFi Analyst Sees 70% Upside Potential
Despite the mixed technical indicators, analysts seem optimistic about SoFi’s future. The consensus among analysts is a buy, with a price target of $8.76, implying a 9.36% upside.
Recent analyst notes, such as one by Mizuho Securities which reiterated a buy rating with a price target of $12, implied a substantial 70% upside potential. These ratings highlight the confidence analysts have in SoFi’s growth prospects.
SoFi Technologies’ stock performance reflects both market volatility and the company’s strategic decisions. While technical indicators provide a mixed outlook, analysts remain bullish on SoFi’s future, citing its prudent approach to personal loan growth and strong financial fundamentals.
Photo: Shutterstock
© 2025 Benzinga.com. Benzinga does not provide investment advice. All rights reserved.
date | ticker | name | Price Target | Upside/Downside | Recommendation | Firm |
|---|
Trade confidently with insights and alerts from analyst ratings, free reports and breaking news that affects the stocks you care about.